Entering Time Series Data
Entering Time Series Data
What Is Time Series Data?
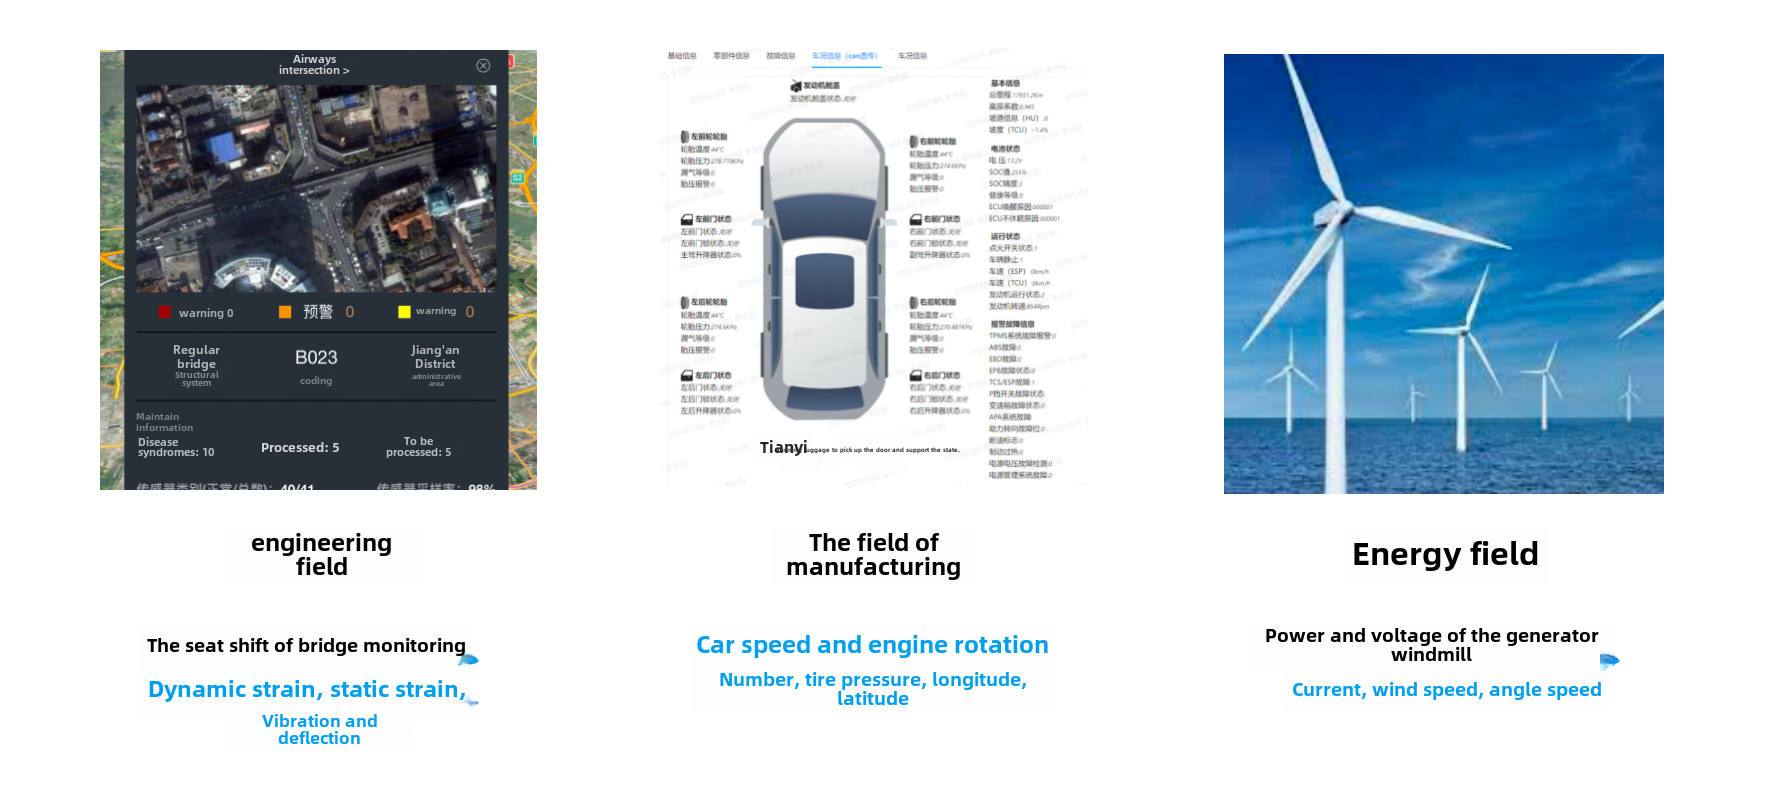
In today's era of the Internet of Things, various scenarios such as the Internet of Things and industrial scenarios are undergoing digital transformation. People collect various states of devices by installing sensors on them. If the motor collects voltage and current, the blade speed, angular velocity, and power generation of the fan; Vehicle collection of latitude and longitude, speed, and fuel consumption; The vibration frequency, deflection, displacement, etc. of the bridge. The data collection of sensors has penetrated into various industries.

Generally speaking, we refer to each collection point as a measurement point (also known as a physical quantity, time series, timeline, signal quantity, indicator, measurement value, etc.). Each measurement point continuously collects new data information over time, forming a time series. In the form of a table, each time series is a table formed by two columns: time and value; In a graphical way, each time series is a trend chart formed over time, which can also be vividly referred to as the device's electrocardiogram.

The massive time series data generated by sensors is the foundation of digital transformation in various industries, so our modeling of time series data mainly focuses on equipment and sensors.
Key Concepts of Time Series Data
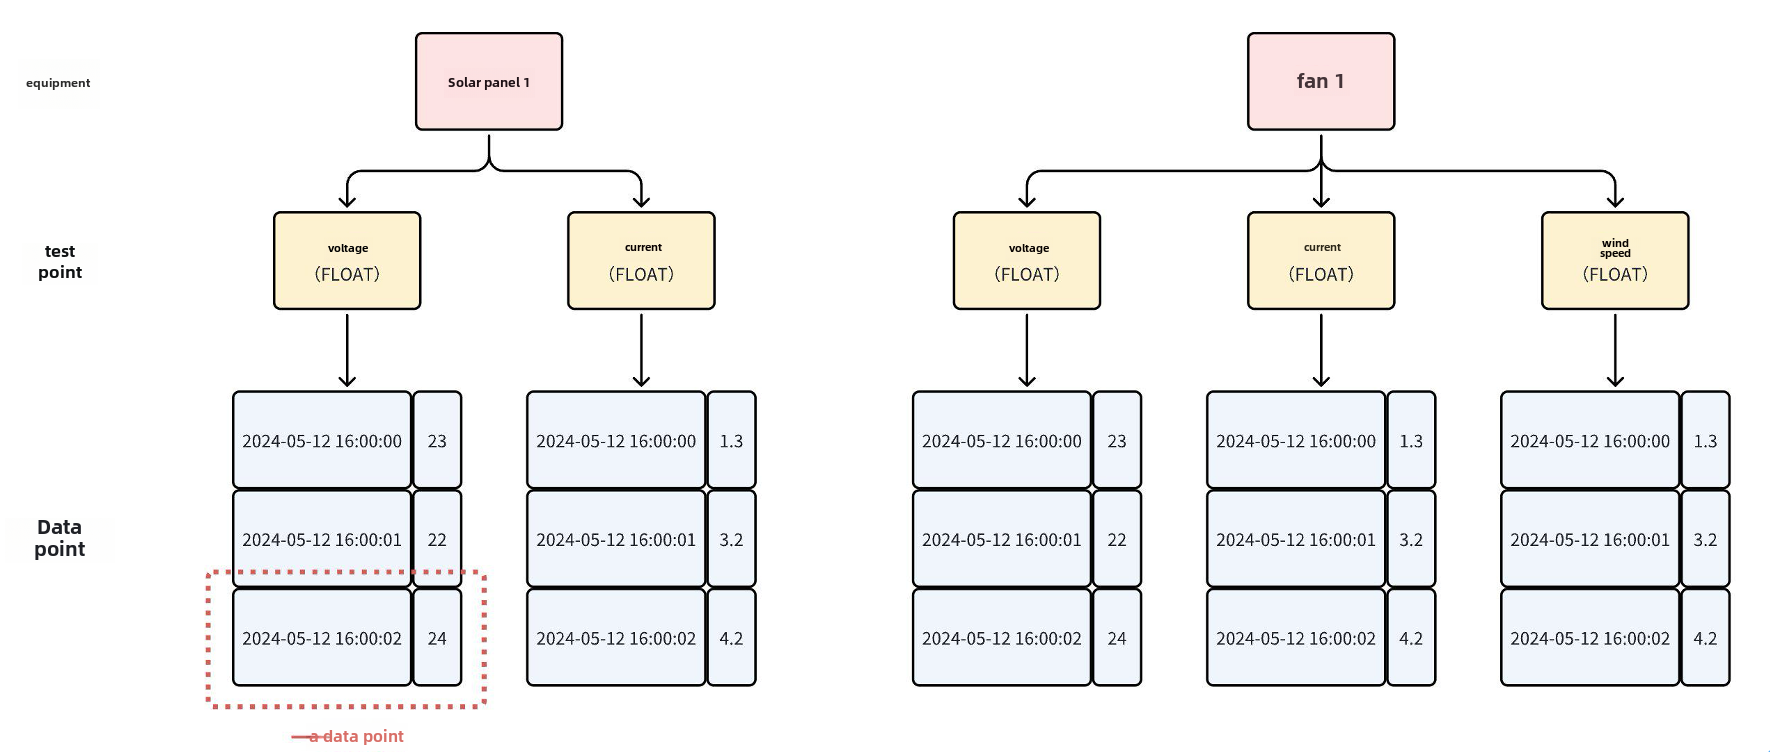
The main concepts involved in time-series data can be divided from bottom to top: data points, measurement points, and equipment.

Data Point
- Definition: Consists of a timestamp and a value, where the timestamp is of type long and the value can be of various types such as BOOLEAN, FLOAT, INT32, etc.
- Example: A row of a time series in the form of a table in the above figure, or a point of a time series in the form of a graph, is a data point.

Measurement Points
- Definition: It is a time series formed by multiple data points arranged in increments according to timestamps. Usually, a measuring point represents a collection point and can regularly collect physical quantities of the environment it is located in.
- Also known as: physical quantity, time series, timeline, semaphore, indicator, measurement value, etc
- Example:
- Electricity scenario: current, voltage
- Energy scenario: wind speed, rotational speed
- Vehicle networking scenarios: fuel consumption, vehicle speed, longitude, dimensions
- Factory scenario: temperature, humidity
Device
- Definition: Corresponding to a physical device in an actual scene, usually a collection of measurement points, identified by one to multiple labels
- Example:
- Vehicle networking scenario: Vehicles identified by vehicle identification code (VIN)
- Factory scenario: robotic arm, unique ID identification generated by IoT platform
- Energy scenario: Wind turbines, identified by region, station, line, model, instance, etc
- Monitoring scenario: CPU, identified by machine room, rack, Hostname, device type, etc