Monitoring Panel Deployment
Monitoring Panel Deployment
The IoTDB monitoring panel is one of the supporting tools for the IoTDB Enterprise Edition. It aims to solve the monitoring problems of IoTDB and its operating system, mainly including operating system resource monitoring, IoTDB performance monitoring, and hundreds of kernel monitoring indicators, in order to help users monitor the health status of the cluster, and perform cluster optimization and operation. This article will take common 3C3D clusters (3 Confignodes and 3 Datanodes) as examples to introduce how to enable the system monitoring module in an IoTDB instance and use Prometheus+Grafana to visualize the system monitoring indicators.
The instructions for using the monitoring panel tool can be found in the Instructions section of the document.
1. Installation Preparation
- Installing IoTDB: You need to first install IoTDB V1.0 or above Enterprise Edition. You can contact business or technical support to obtain
- Obtain the IoTDB monitoring panel installation package: Based on the enterprise version of IoTDB database monitoring panel, you can contact business or technical support to obtain
2. Installation Steps
2.1 IoTDB enables monitoring indicator collection
- Open the monitoring configuration item. The configuration items related to monitoring in IoTDB are disabled by default. Before deploying the monitoring panel, you need to open the relevant configuration items (note that the service needs to be restarted after enabling monitoring configuration).
| Configuration | Located in the configuration file | Description |
|---|---|---|
| cn_metric_reporter_list | conf/iotdb-system.properties | Uncomment the configuration item and set the value to PROMETHEUS |
| cn_metric_level | conf/iotdb-system.properties | Uncomment the configuration item and set the value to IMPORTANT |
| cn_metric_prometheus_reporter_port | conf/iotdb-system.properties | Uncomment the configuration item to maintain the default setting of 9091. If other ports are set, they will not conflict with each other |
| dn_metric_reporter_list | conf/iotdb-system.properties | Uncomment the configuration item and set the value to PROMETHEUS |
| dn_metric_level | conf/iotdb-system.properties | Uncomment the configuration item and set the value to IMPORTANT |
| dn_metric_prometheus_reporter_port | conf/iotdb-system.properties | Uncomment the configuration item and set it to 9092 by default. If other ports are set, they will not conflict with each other |
Taking the 3C3D cluster as an example, the monitoring configuration that needs to be modified is as follows:
| Node IP | Host Name | Cluster Role | Configuration File Path | Configuration |
|---|---|---|---|---|
| 192.168.1.3 | iotdb-1 | confignode | conf/iotdb-system.properties | cn_metric_reporter_list=PROMETHEUS cn_metric_level=IMPORTANT cn_metric_prometheus_reporter_port=9091 |
| 192.168.1.4 | iotdb-2 | confignode | conf/iotdb-system.properties | cn_metric_reporter_list=PROMETHEUS cn_metric_level=IMPORTANT cn_metric_prometheus_reporter_port=9091 |
| 192.168.1.5 | iotdb-3 | confignode | conf/iotdb-system.properties | cn_metric_reporter_list=PROMETHEUS cn_metric_level=IMPORTANT cn_metric_prometheus_reporter_port=9091 |
| 192.168.1.3 | iotdb-1 | datanode | conf/iotdb-system.properties | dn_metric_reporter_list=PROMETHEUS dn_metric_level=IMPORTANT dn_metric_prometheus_reporter_port=9092 |
| 192.168.1.4 | iotdb-2 | datanode | conf/iotdb-system.properties | dn_metric_reporter_list=PROMETHEUS dn_metric_level=IMPORTANT dn_metric_prometheus_reporter_port=9092 |
| 192.168.1.5 | iotdb-3 | datanode | conf/iotdb-system.properties | dn_metric_reporter_list=PROMETHEUS dn_metric_level=IMPORTANT dn_metric_prometheus_reporter_port=9092 |
- Restart all nodes. After modifying the monitoring indicator configuration of three nodes, the confignode and datanode services of all nodes can be restarted:
./sbin/stop-standalone.sh      #Stop confignode and datanode first
./sbin/start-confignode.sh  -d #Start confignode
./sbin/start-datanode.sh -d #Start datanode- After restarting, confirm the running status of each node through the client. If the status is Running, it indicates successful configuration:

2.2 Install and configure Prometheus
Taking Prometheus installed on server 192.168.1.3 as an example.
- Download the Prometheus installation package, which requires installation of V2.30.3 and above. You can go to the Prometheus official website to download it(https://prometheus.io/docs/introduction/first_steps/)
- Unzip the installation package and enter the unzipped folder:
tar xvfz prometheus-*.tar.gz
cd prometheus-*- Modify the configuration. Modify the configuration file prometheus.yml as follows
- Add configNode task to collect monitoring data for ConfigNode
- Add a datanode task to collect monitoring data for DataNodes
global:
  scrape_interval: 15s
  evaluation_interval: 15s
scrape_configs:
  - job_name: "prometheus"
    static_configs:
      - targets: ["localhost:9090"]
  - job_name: "confignode"
    static_configs:
      - targets: ["iotdb-1:9091","iotdb-2:9091","iotdb-3:9091"]
    honor_labels: true
  - job_name: "datanode"
    static_configs:
      - targets: ["iotdb-1:9092","iotdb-2:9092","iotdb-3:9092"]
honor_labels: true- Start Prometheus. The default expiration time for Prometheus monitoring data is 15 days. In production environments, it is recommended to adjust it to 180 days or more to track historical monitoring data for a longer period of time. The startup command is as follows:
./prometheus --config.file=prometheus.yml --storage.tsdb.retention.time=180dConfirm successful startup. Enter in browser http://192.168.1.3:9090 Go to Prometheus and click on the Target interface under Status. When you see that all States are Up, it indicates successful configuration and connectivity.
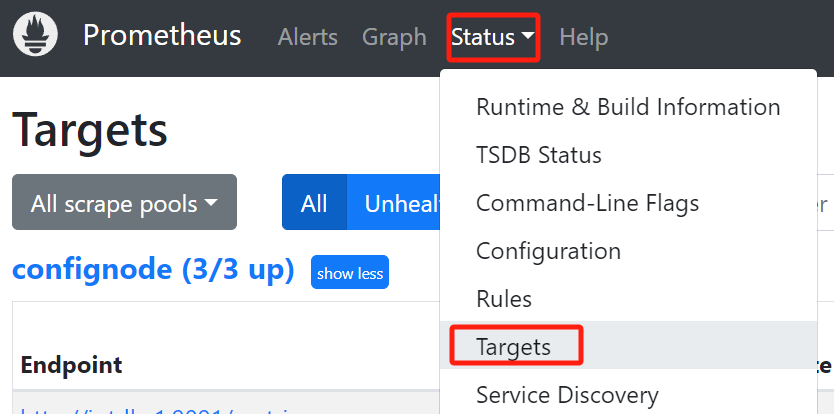
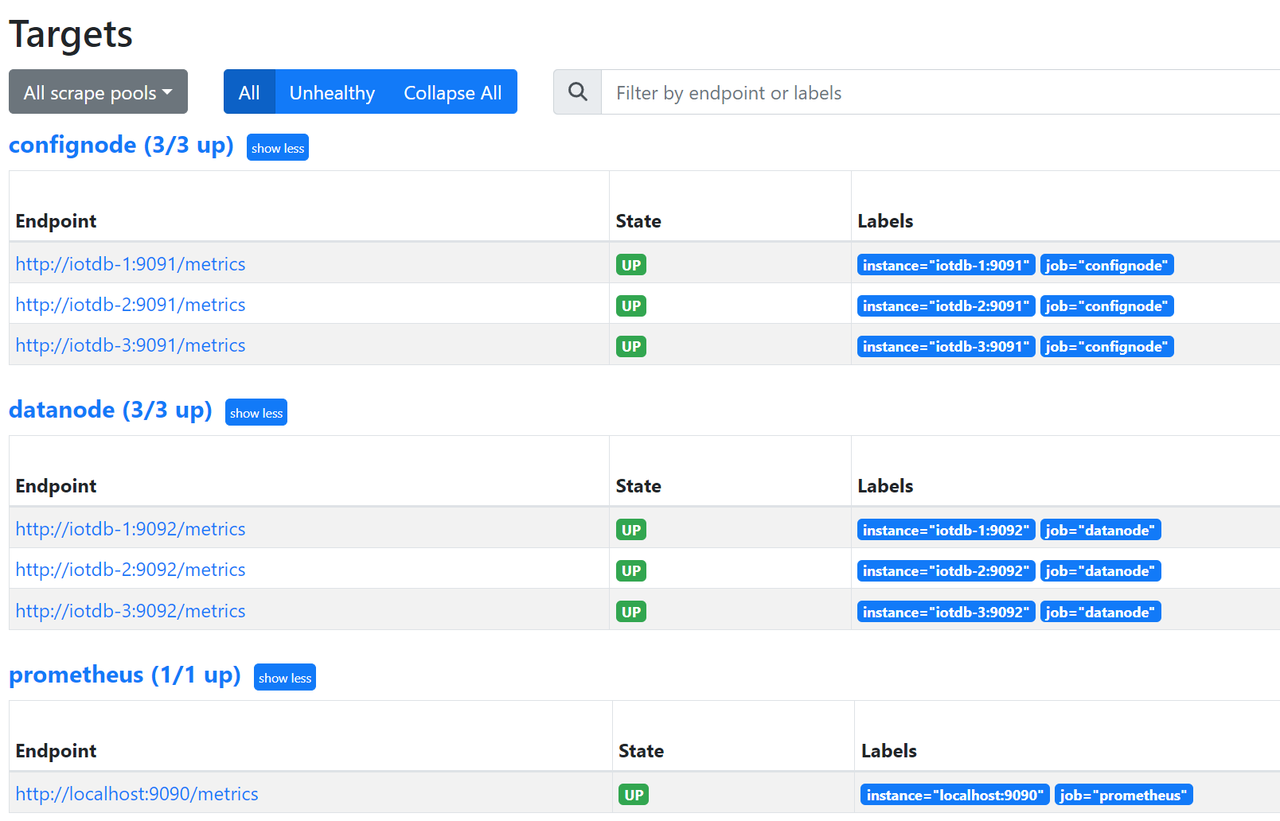
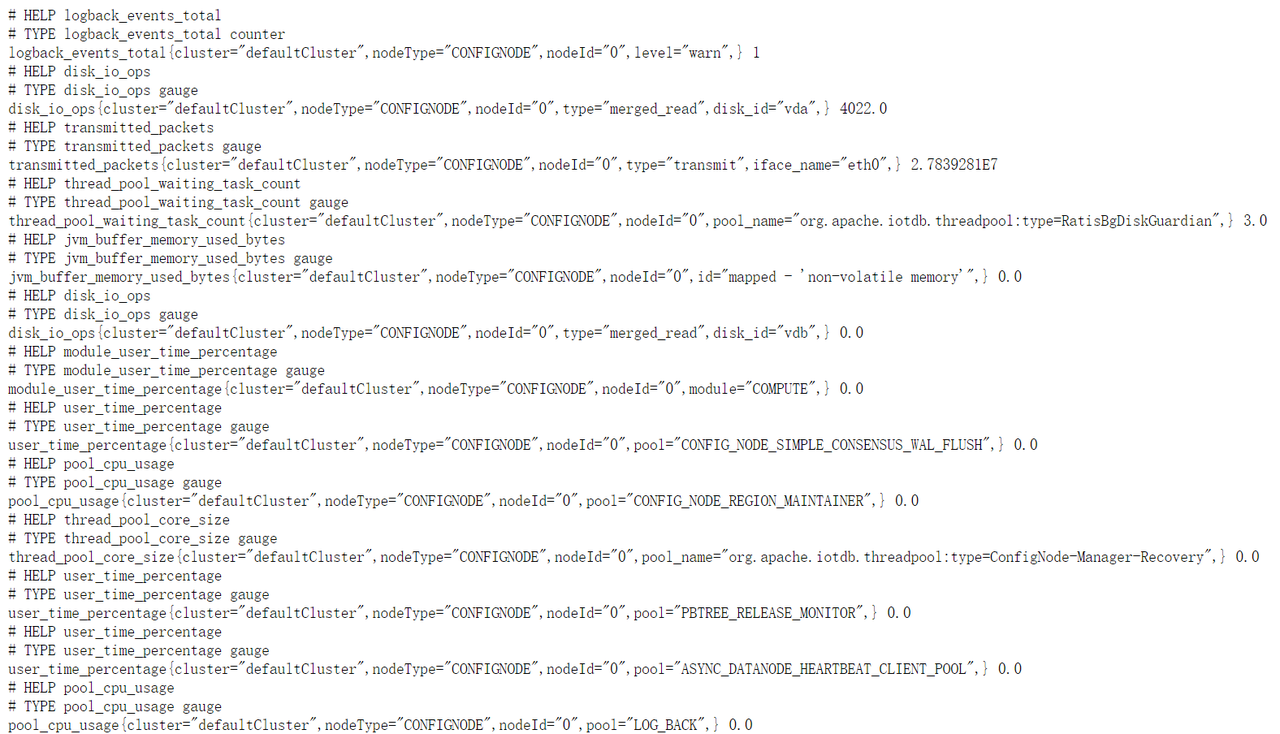
Clicking on the left link in Targets will redirect you to web monitoring and view the monitoring information of the corresponding node:
2.3 Install Grafana and configure the data source
Taking Grafana installed on server 192.168.1.3 as an example.
- Download the Grafana installation package, which requires installing version 8.4.2 or higher. You can go to the Grafana official website to download it(https://grafana.com/grafana/download)
- Unzip and enter the corresponding folder
tar -zxvf grafana-*.tar.gz
cd grafana-*- Start Grafana:
./bin/grafana-server webLog in to Grafana. Enter in browser http://192.168.1.3:3000 (or the modified port), enter Grafana, and the default initial username and password are both admin.
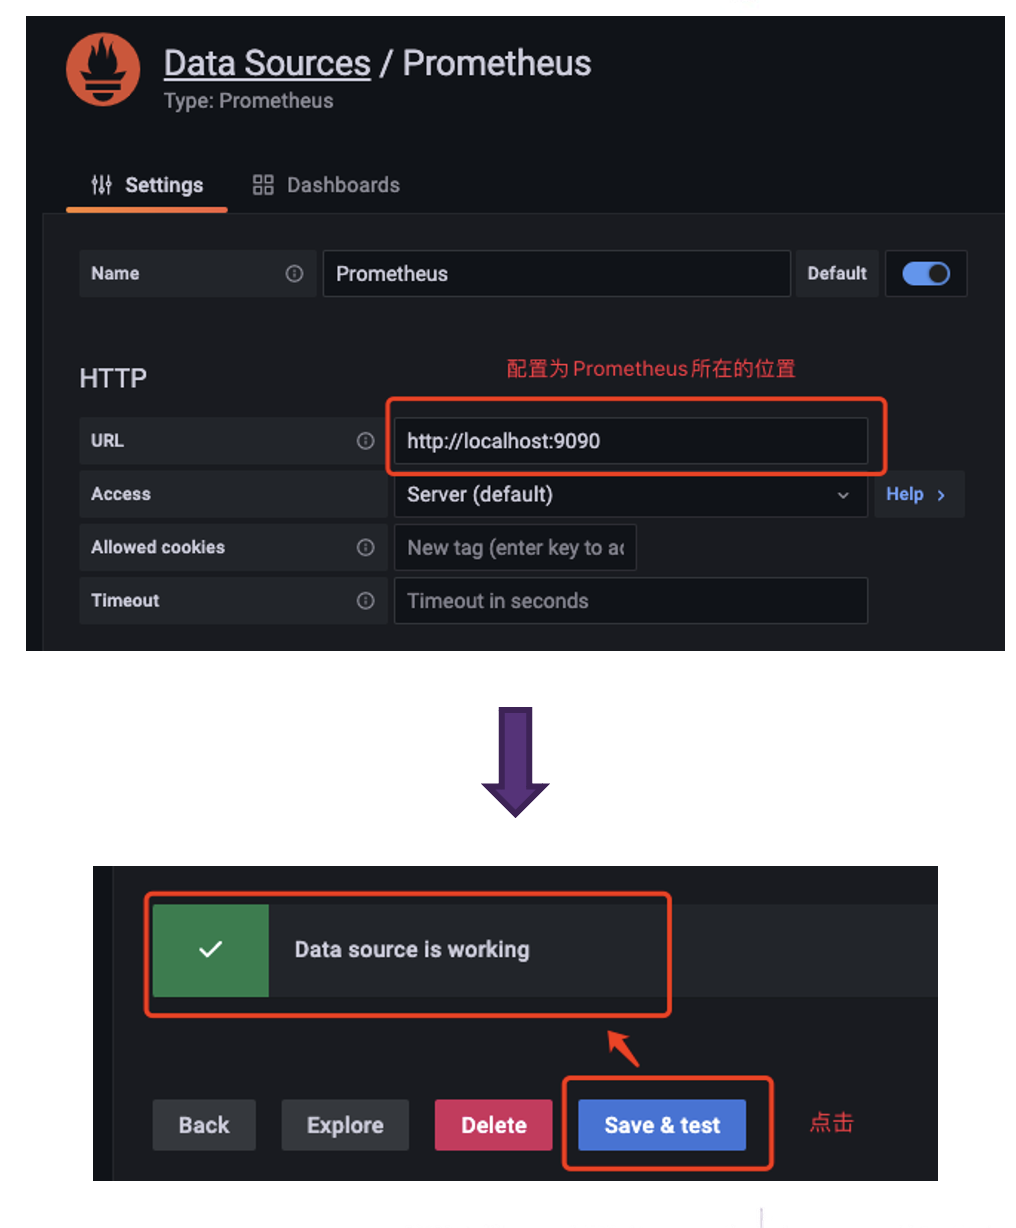
Configure data sources. Find Data sources in Connections, add a new data source, and configure the Data Source to Prometheus
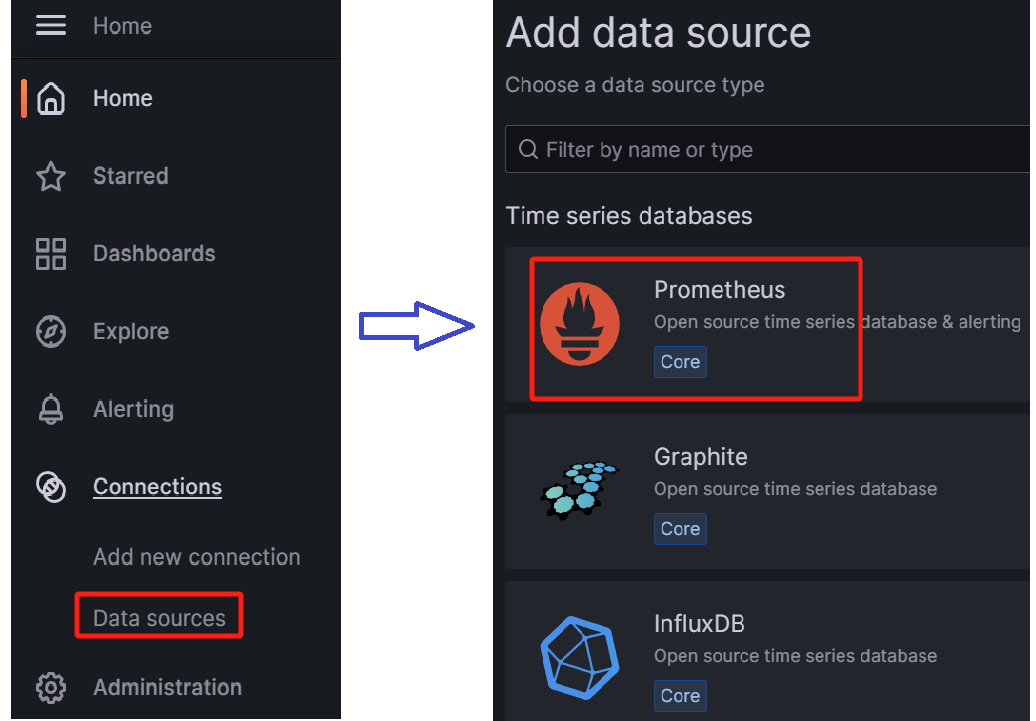
When configuring the Data Source, pay attention to the URL where Prometheus is located. After configuring it, click on Save&Test and a Data Source is working prompt will appear, indicating successful configuration
2.4 Import IoTDB Grafana Dashboards
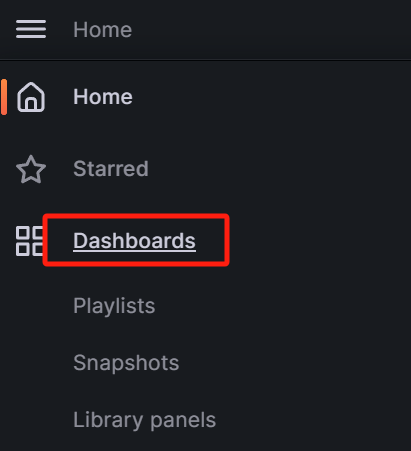
Enter Grafana and select Dashboards:
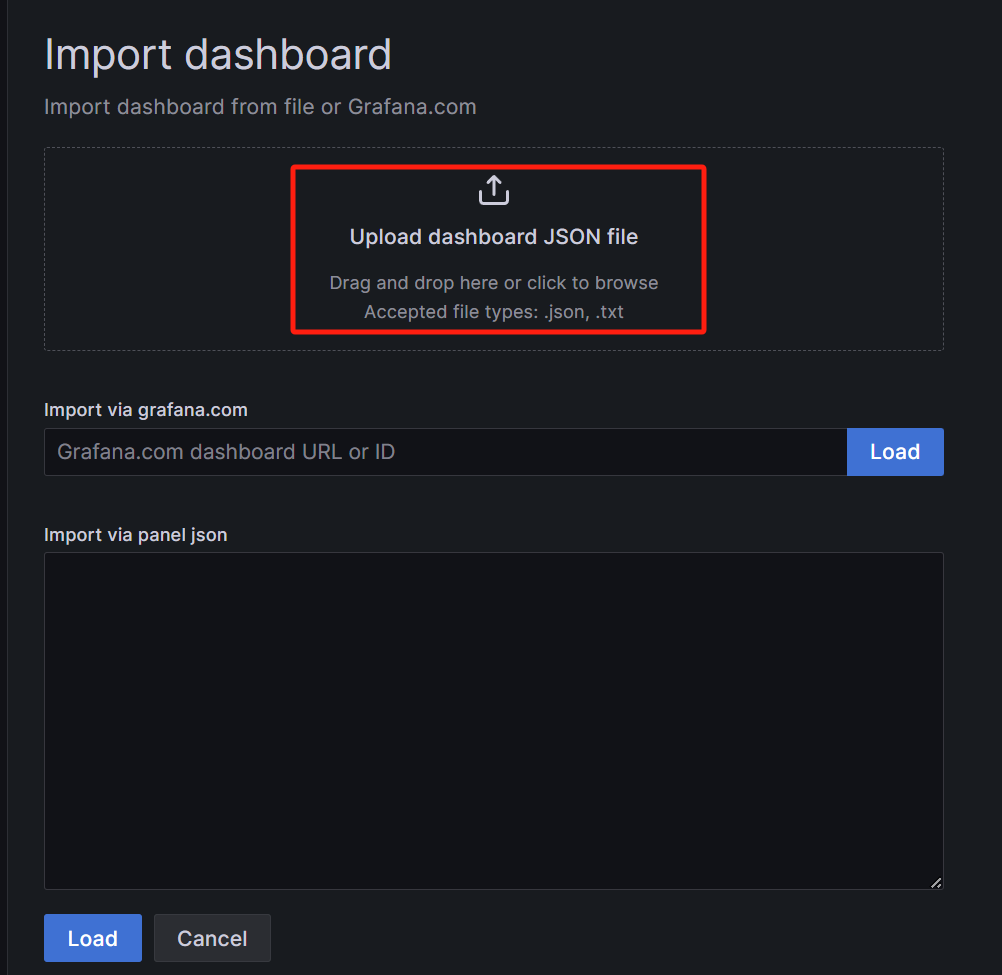
Click the Import button on the right side

Import Dashboard using upload JSON file
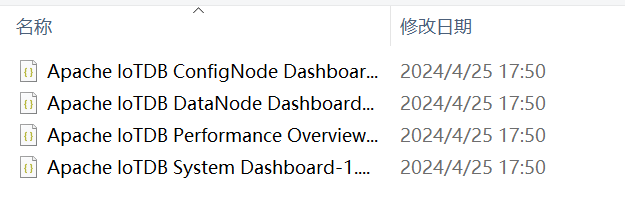
Select the JSON file of one of the panels in the IoTDB monitoring panel, using the Apache IoTDB ConfigNode Dashboard as an example (refer to the installation preparation section in this article for the monitoring panel installation package):
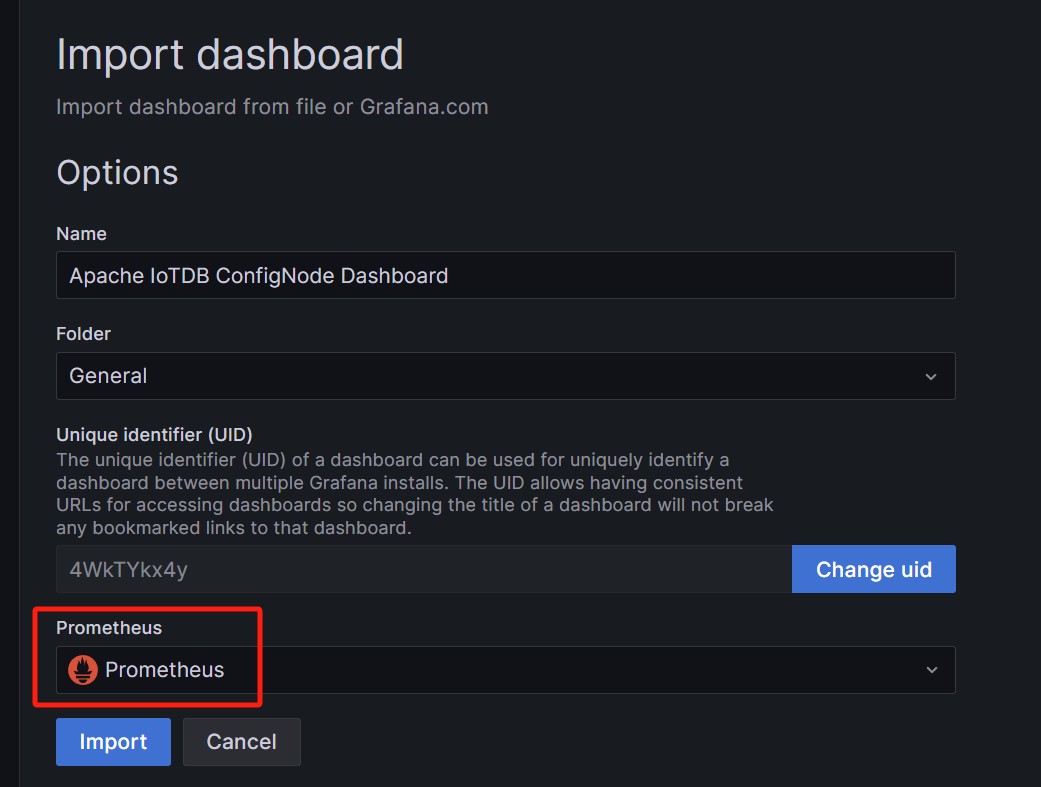
Select Prometheus as the data source and click Import
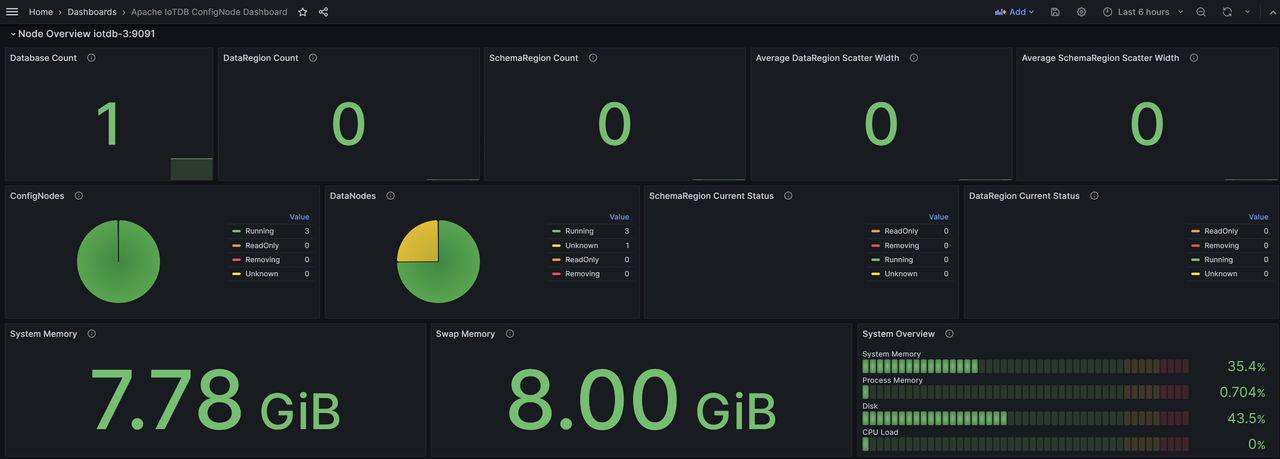
Afterwards, you can see the imported Apache IoTDB ConfigNode Dashboard monitoring panel
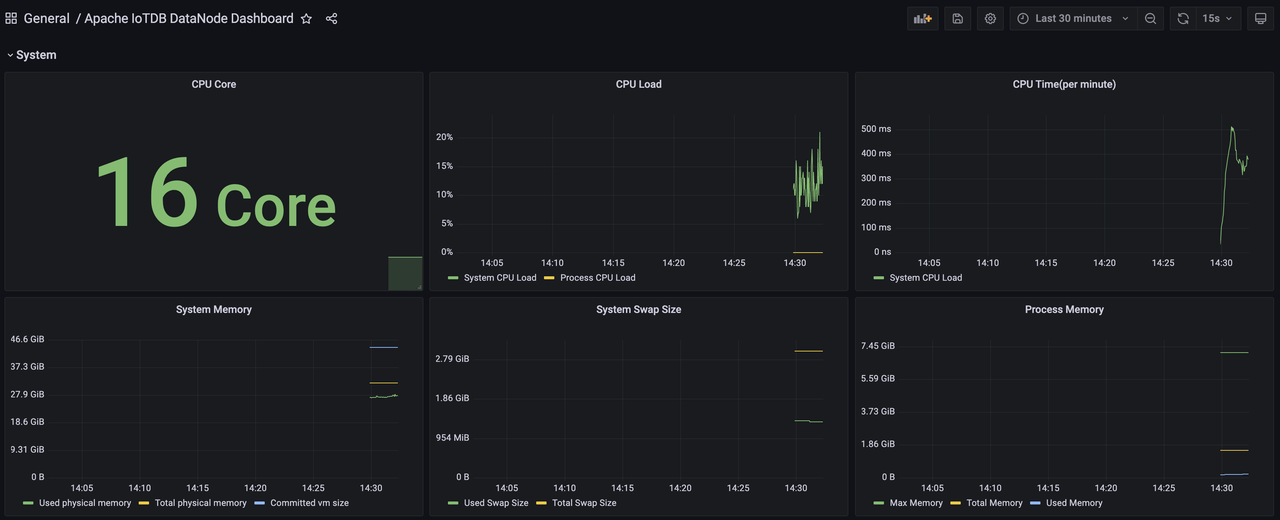
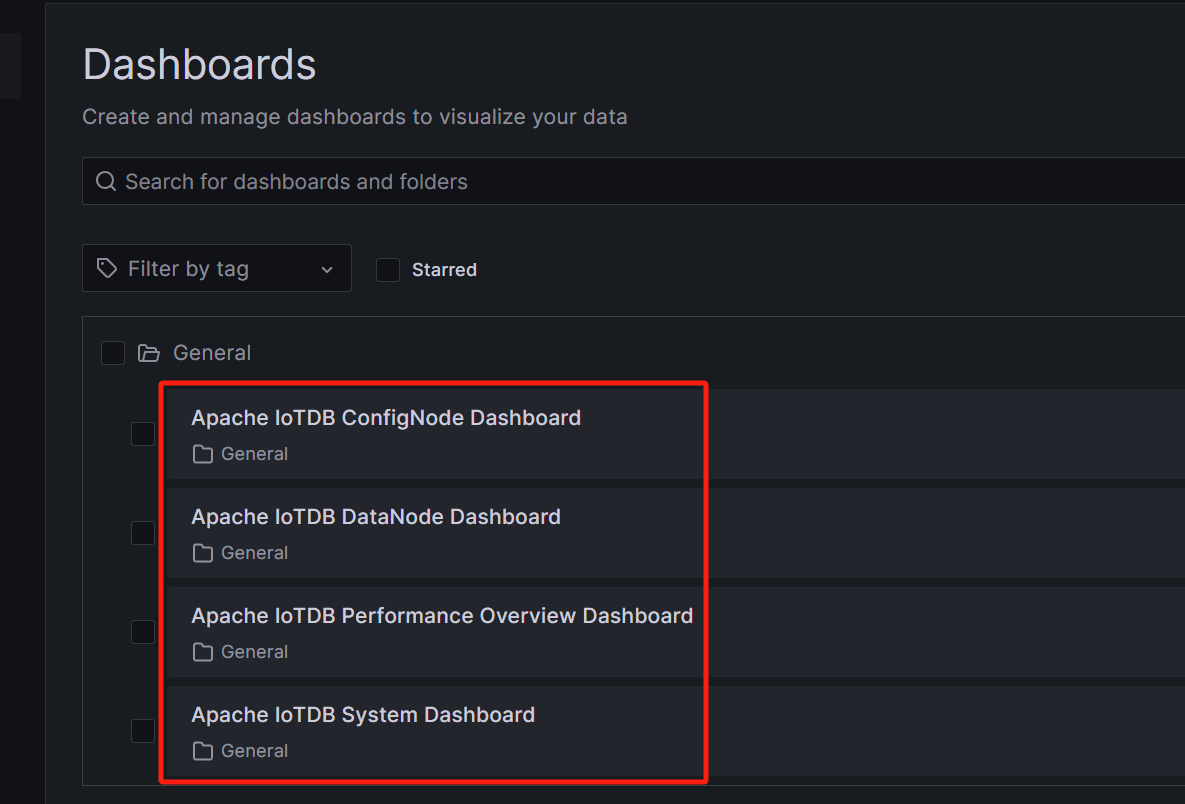
Similarly, we can import the Apache IoTDB DataNode Dashboard Apache Performance Overview Dashboard、Apache System Overview Dashboard, You can see the following monitoring panel:

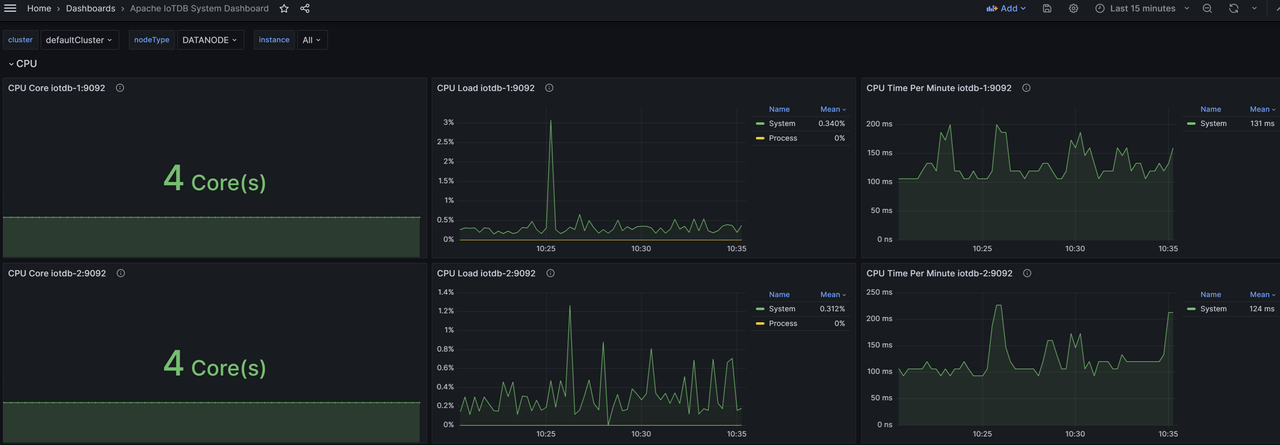
At this point, all IoTDB monitoring panels have been imported and monitoring information can now be viewed at any time.
3. Appendix, Detailed Explanation of Monitoring Indicators
3.1 System Dashboard
This panel displays the current usage of system CPU, memory, disk, and network resources, as well as partial status of the JVM.
CPU
- CPU Cores:CPU cores
- CPU Utilization:
- System CPU Utilization:The average CPU load and busyness of the entire system during the sampling time
- Process CPU Utilization:The proportion of CPU occupied by the IoTDB process during sampling time
- CPU Time Per Minute:The total CPU time of all processes in the system per minute
Memory
- System Memory:The current usage of system memory.
- Commited VM Size: The size of virtual memory allocated by the operating system to running processes.
- Total Physical Memory:The total amount of available physical memory in the system.
- Used Physical Memory:The total amount of memory already used by the system. Contains the actual amount of memory used by the process and the memory occupied by the operating system buffers/cache.
- System Swap Memory:Swap Space memory usage.
- Process Memory:The usage of memory by the IoTDB process.
- Max Memory:The maximum amount of memory that an IoTDB process can request from the operating system. (Configure the allocated memory size in the datanode env/configure env configuration file)
- Total Memory:The total amount of memory that the IoTDB process has currently requested from the operating system.
- Used Memory:The total amount of memory currently used by the IoTDB process.
Disk
- Disk Space:
- Total Disk Space:The maximum disk space that IoTDB can use.
- Used Disk Space:The disk space already used by IoTDB.
- Logs Per Minute:The average number of logs at each level of IoTDB per minute during the sampling time.
- File Count:Number of IoTDB related files
- All:All file quantities
- TsFile:Number of TsFiles
- Seq:Number of sequential TsFiles
- Unseq:Number of unsequence TsFiles
- WAL:Number of WAL files
- Cross-Temp:Number of cross space merge temp files
- Inner-Seq-Temp:Number of merged temp files in sequential space
- Innsr-Unseq-Temp:Number of merged temp files in unsequential space
- Mods:Number of tombstone files
- Open File Handles:Number of file handles opened by the system
- File Size:The size of IoTDB related files. Each sub item corresponds to the size of the corresponding file.
- Disk Utilization (%):Equivalent to the% util indicator in iostat, it to some extent reflects the level of disk busyness. Each sub item is an indicator corresponding to the disk.
- Disk I/O Throughput:The average I/O throughput of each disk in the system over a period of time. Each sub item is an indicator corresponding to the disk.
- Disk IOPS:Equivalent to the four indicators of r/s, w/s, rrqm/s, and wrqm/s in iostat, it refers to the number of times a disk performs I/O per second. Read and write refer to the number of times a disk performs a single I/O. Due to the corresponding scheduling algorithm of block devices, in some cases, multiple adjacent I/Os can be merged into one. Merge read and merge write refer to the number of times multiple I/Os are merged into one I/O.
- Disk I/O Latency (Avg):Equivalent to the await of iostat, which is the average latency of each I/O request. Separate recording of read and write requests.
- Disk I/O Request Size (Avg):Equivalent to the avgrq sz of iostat, it reflects the size of each I/O request. Separate recording of read and write requests.
- Disk I/O Queue Length (Avg):Equivalent to avgqu sz in iostat, which is the average length of the I/O request queue.
- I/O Syscall Rate:The frequency of process calls to read and write system calls, similar to IOPS.
- I/O Throughput:The throughput of process I/O can be divided into two categories: actual-read/write and attemppt-read/write. Actual read and actual write refer to the number of bytes that a process actually causes block devices to perform I/O, excluding the parts processed by Page Cache.
JVM
- GC Time Percentage:The proportion of GC time spent by the node JVM in the past minute's time window
- GC Allocated/Promoted Size: The average size of objects promoted to the old era per minute by the node JVM, as well as the size of objects newly applied for by the new generation/old era and non generational new applications
- GC Live Data Size:The long-term surviving object size of the node JVM and the maximum intergenerational allowed value
- Heap Memory:JVM heap memory usage.
- Maximum heap memory:The maximum available heap memory size for the JVM.
- Committed heap memory:The size of heap memory that has been committed by the JVM.
- Used heap memory:The size of heap memory already used by the JVM.
- PS Eden Space:The size of the PS Young area.
- PS Old Space:The size of the PS Old area.
- PS Survivor Space:The size of the PS survivor area.
- ...(CMS/G1/ZGC, etc)
- Off-Heap Memory:Out of heap memory usage.
- Direct Memory:Out of heap direct memory.
- Mapped Memory:Out of heap mapped memory.
- GCs Per Minute:The average number of garbage collection attempts per minute by the node JVM, including YGC and FGC
- GC Latency Per Minute:The average time it takes for node JVM to perform garbage collection per minute, including YGC and FGC
- GC Events Breakdown Per Minute:The average number of garbage collections per minute by node JVM due to different reasons, including YGC and FGC
- GC Pause Time Breakdown Per Minute:The average time spent by node JVM on garbage collection per minute due to different reasons, including YGC and FGC
- JIT Compilation Time Per Minute:The total time JVM spends compiling per minute
- Loaded & Unloaded Classes:
- Loaded:The number of classes currently loaded by the JVM
- Unloaded:The number of classes uninstalled by the JVM since system startup
- Active Java Threads:The current number of surviving threads in IoTDB. Each sub item represents the number of threads in each state.
Network
Eno refers to the network card connected to the public network, while lo refers to the virtual network card.
- Network Speed:The speed of network card sending and receiving data
- Network Throughput (Receive/Transmit):The size of data packets sent or received by the network card, calculated from system restart
- Packet Transmission Rate:The speed at which the network card sends and receives packets, and one RPC request can correspond to one or more packets
- Active TCP Connections:The current number of socket connections for the selected process (IoTDB only has TCP)
3.2 Performance Overview Dashboard
Cluster Overview
- Total CPU Cores:Total CPU cores of cluster machines
- DataNode CPU Load:CPU usage of each DataNode node in the cluster
- Disk
- Total Disk Space: Total disk size of cluster machines
- DataNode Disk Utilization: The disk usage rate of each DataNode in the cluster
- Total Time Series: The total number of time series managed by the cluster (including replicas), the actual number of time series needs to be calculated in conjunction with the number of metadata replicas
- Cluster Info: Number of ConfigNode and DataNode nodes in the cluster
- Up Time: The duration of cluster startup until now
- Total Write Throughput: The total number of writes per second in the cluster (including replicas), and the actual total number of writes needs to be analyzed in conjunction with the number of data replicas
- Memory
- Total System Memory: Total memory size of cluster machine system
- Total Swap Memory: Total size of cluster machine swap memory
- DataNode Process Memory Utilization: Memory usage of each DataNode in the cluster
- Total Files:Total number of cluster management files
- Cluster System Overview:Overview of cluster machines, including average DataNode node memory usage and average machine disk usage
- Total DataBases: The total number of databases managed by the cluster (including replicas)
- Total DataRegions: The total number of DataRegions managed by the cluster
- Total SchemaRegions: The total number of SchemeRegions managed by the cluster
Node Overview
- CPU Cores: The number of CPU cores in the machine where the node is located
- Disk Space: The disk size of the machine where the node is located
- Time Series: Number of time series managed by the machine where the node is located (including replicas)
- System Overview: System overview of the machine where the node is located, including CPU load, process memory usage ratio, and disk usage ratio
- Write Throughput: The write speed per second of the machine where the node is located (including replicas)
- System Memory: The system memory size of the machine where the node is located
- Swap Memory:The swap memory size of the machine where the node is located
- File Count: Number of files managed by nodes
Performance
- Session Idle Time:The total idle time and total busy time of the session connection of the node
- Client Connections: The client connection status of the node, including the total number of connections and the number of active connections
- Operation Latency: The time consumption of various types of node operations, including average and P99
- Average Interface Latency: The average time consumption of each thrust interface of a node
- P99 Interface Latency: P99 time consumption of various thrust interfaces of nodes
- Total Tasks: The number of system tasks for each node
- Average Task Latency: The average time spent on various system tasks of a node
- P99 Task Latency: P99 time consumption for various system tasks of nodes
- Operations Per Second: The number of operations per second for a node
- Mainstream Process
- Operations Per Second (Stage-wise): The number of operations per second for each stage of the node's main process
- Average Stage Latency: The average time consumption of each stage in the main process of a node
- P99 Stage Latency: P99 time consumption for each stage of the node's main process
- Schedule Stage
- Schedule Operations Per Second: The number of operations per second in each sub stage of the node schedule stage
- Average Schedule Stage Latency:The average time consumption of each sub stage in the node schedule stage
- P99 Schedule Stage Latency: P99 time consumption for each sub stage of the schedule stage of the node
- Local Schedule Sub Stages
- Local Schedule Operations Per Second: The number of operations per second in each sub stage of the local schedule node
- Average Local Schedule Stage Latency: The average time consumption of each sub stage in the local schedule stage of the node
- P99 Local Schedule Latency: P99 time consumption for each sub stage of the local schedule stage of the node
- Storage Stage
- Storage Operations Per Second: The number of operations per second in each sub stage of the node storage stage
- Average Storage Stage Latency: Average time consumption of each sub stage in the node storage stage
- P99 Storage Stage Latency: P99 time consumption for each sub stage of node storage stage
- Engine Stage
- Engine Operations Per Second: The number of operations per second in each sub stage of the node engine stage
- Average Engine Stage Latency: The average time consumption of each sub stage in the engine stage of a node
- P99 Engine Stage Latency: P99 time consumption of each sub stage in the node engine stage
System
- CPU Utilization: CPU load of nodes
- CPU Latency Per Minute: The CPU time per minute of a node, with the maximum value related to the number of CPU cores
- GC Latency Per Minute:The average GC time per minute for nodes, including YGC and FGC
- Heap Memory: Node's heap memory usage
- Off-Heap Memory: Non heap memory usage of nodes
- Total Java Threads: Number of Java threads on nodes
- File Count:Number of files managed by nodes
- File Size: Node management file size situation
- Logs Per Minute: Different types of logs per minute for nodes
3.3 ConfigNode Dashboard
This panel displays the performance of all management nodes in the cluster, including partitioning, node information, and client connection statistics.
Node Overview
- Database Count: Number of databases for nodes
- Region
- DataRegion Count:Number of DataRegions for nodes
- DataRegion Status: The state of the DataRegion of the node
- SchemaRegion Count: Number of SchemeRegions for nodes
- SchemaRegion Status: The state of the SchemeRegion of the node
- System Memory Utilization: The system memory size of the node
- Swap Memory Utilization: Node's swap memory size
- ConfigNodes Status: The running status of the ConfigNode in the cluster where the node is located
- DataNodes Status:The DataNode situation of the cluster where the node is located
- System Overview: System overview of nodes, including system memory, disk usage, process memory, and CPU load
NodeInfo
- Node Count: The number of nodes in the cluster where the node is located, including ConfigNode and DataNode
- ConfigNode Status: The status of the ConfigNode node in the cluster where the node is located
- DataNode Status: The status of the DataNode node in the cluster where the node is located
- SchemaRegion Distribution: The distribution of SchemaRegions in the cluster where the node is located
- SchemaRegionGroup Leader Distribution: The distribution of leaders in the SchemaRegionGroup of the cluster where the node is located
- DataRegion Distribution: The distribution of DataRegions in the cluster where the node is located
- DataRegionGroup Leader Distribution:The distribution of leaders in the DataRegionGroup of the cluster where the node is located
Protocol
- Client Count
- Active Clients: The number of active clients in each thread pool of a node
- Idle Clients: The number of idle clients in each thread pool of a node
- Borrowed Clients Per Second: Number of borrowed clients in each thread pool of the node
- Created Clients Per Second: Number of created clients for each thread pool of the node
- Destroyed Clients Per Second: The number of destroyed clients in each thread pool of the node
- Client time situation
- Average Client Active Time: The average active time of clients in each thread pool of a node
- Average Client Borrowing Latency: The average borrowing waiting time of clients in each thread pool of a node
- Average Client Idle Time: The average idle time of clients in each thread pool of a node
Partition Table
- SchemaRegionGroup Count: The number of SchemaRegionGroups in the Database of the cluster where the node is located
- DataRegionGroup Count: The number of DataRegionGroups in the Database of the cluster where the node is located
- SeriesSlot Count: The number of SeriesSlots in the Database of the cluster where the node is located
- TimeSlot Count: The number of TimeSlots in the Database of the cluster where the node is located
- DataRegion Status: The DataRegion status of the cluster where the node is located
- SchemaRegion Status: The status of the SchemeRegion of the cluster where the node is located
Consensus
- Ratis Stage Latency: The time consumption of each stage of the node's Ratis
- Write Log Entry Latency: The time required to write a log for the Ratis of a node
- Remote / Local Write Latency: The time consumption of remote and local writes for the Ratis of nodes
- Remote / Local Write Throughput: Remote and local QPS written to node Ratis
- RatisConsensus Memory Utilization: Memory usage of Node Ratis consensus protocol
3.4 DataNode Dashboard
This panel displays the monitoring status of all data nodes in the cluster, including write time, query time, number of stored files, etc.
Node Overview
- Total Managed Entities: Entity situation of node management
- Write Throughput: The write speed per second of the node
- Memory Usage: The memory usage of the node, including the memory usage of various parts of IoT Consensus, the total memory usage of SchemaRegion, and the memory usage of various databases.
Protocol
- Node Operation Time Consumption
- Average Operation Latency: The average time spent on various operations of a node
- P50 Operation Latency: The median time spent on various operations of a node
- P99 Operation Latency: P99 time consumption for various operations of nodes
- Thrift Statistics
- Thrift Interface QPS: QPS of various Thrift interfaces of nodes
- Average Thrift Interface Latency: The average time consumption of each Thrift interface of a node
- Thrift Connections: The number of Thrfit connections of each type of node
- Active Thrift Threads: The number of active Thrift connections for each type of node
- Client Statistics
- Active Clients: The number of active clients in each thread pool of a node
- Idle Clients: The number of idle clients in each thread pool of a node
- Borrowed Clients Per Second:Number of borrowed clients for each thread pool of a node
- Created Clients Per Second: Number of created clients for each thread pool of the node
- Destroyed Clients Per Second: The number of destroyed clients in each thread pool of the node
- Average Client Active Time: The average active time of clients in each thread pool of a node
- Average Client Borrowing Latency: The average borrowing waiting time of clients in each thread pool of a node
- Average Client Idle Time: The average idle time of clients in each thread pool of a node
Storage Engine
- File Count: Number of files of various types managed by nodes
- File Size: Node management of various types of file sizes
- TsFile
- Total TsFile Size Per Level: The total size of TsFile files at each level of node management
- TsFile Count Per Level: Number of TsFile files at each level of node management
- Average TsFile Size Per Level: The average size of TsFile files at each level of node management
- Total Tasks: Number of Tasks for Nodes
- Task Latency: The time consumption of tasks for nodes
- Compaction
- Compaction Read/Write Throughput: The merge read and write speed of nodes per second
- Compactions Per Minute: The number of merged nodes per minute
- Compaction Chunk Status: The number of Chunks in different states merged by nodes
- Compacted-Points Per Minute: The number of merged nodes per minute
Write Performance
- Average Write Latency: Average node write time, including writing wal and memtable
- P50 Write Latency: Median node write time, including writing wal and memtable
- P99 Write Latency: P99 for node write time, including writing wal and memtable
- WAL
- WAL File Size: Total size of WAL files managed by nodes
- WAL Files:Number of WAL files managed by nodes
- WAL Nodes: Number of WAL nodes managed by nodes
- Checkpoint Creation Time: The time required to create various types of CheckPoints for nodes
- WAL Serialization Time (Total): Total time spent on node WAL serialization
- Data Region Mem Cost: Memory usage of different DataRegions of nodes, total memory usage of DataRegions of the current instance, and total memory usage of DataRegions of the current cluster
- Serialize One WAL Info Entry Cost: Node serialization time for a WAL Info Entry
- Oldest MemTable Ram Cost When Cause Snapshot: MemTable size when node WAL triggers oldest MemTable snapshot
- Oldest MemTable Ram Cost When Cause Flush: MemTable size when node WAL triggers oldest MemTable flush
- WALNode Effective Info Ratio: The effective information ratio of different WALNodes of nodes
- WAL Buffer
- WAL Buffer Latency: Node WAL flush SyncBuffer takes time, including both synchronous and asynchronous options
- WAL Buffer Used Ratio: The usage rate of the WAL Buffer of the node
- WAL Buffer Entries Count: The number of entries in the WAL Buffer of a node
- Flush Statistics
- Average Flush Latency: The total time spent on node Flush and the average time spent on each sub stage
- P50 Flush Latency: The total time spent on node Flush and the median time spent on each sub stage
- P99 Flush Latency: The total time spent on node Flush and the P99 time spent on each sub stage
- Average Flush Subtask Latency: The average time consumption of each node's Flush subtask, including sorting, encoding, and IO stages
- P50 Flush Subtask Latency: The median time consumption of each subtask of the Flush node, including sorting, encoding, and IO stages
- P99 Flush Subtask Latency: The average subtask time P99 for Flush of nodes, including sorting, encoding, and IO stages
- Pending Flush Task Num: The number of Flush tasks in a blocked state for a node
- Pending Flush Sub Task Num: Number of Flush subtasks blocked by nodes
- Tsfile Compression Ratio of Flushing MemTable: The compression rate of TsFile corresponding to node flashing Memtable
- Flush TsFile Size of DataRegions: The corresponding TsFile size for each disk flush of nodes in different DataRegions
- Size of Flushing MemTable: The size of the Memtable for node disk flushing
- Points Num of Flushing MemTable: The number of points when flashing data in different DataRegions of a node
- Series Num of Flushing MemTable: The number of time series when flashing Memtables in different DataRegions of a node
- Average Point Num of Flushing MemChunk: The average number of disk flushing points for node MemChunk
Schema Engine
- Schema Engine Mode: The metadata engine pattern of nodes
- Schema Consensus Protocol: Node metadata consensus protocol
- Schema Region Number:Number of SchemeRegions managed by nodes
- Schema Region Memory Overview: The amount of memory in the SchemeRegion of a node
- Memory Usgae per SchemaRegion:The average memory usage size of node SchemaRegion
- Cache MNode per SchemaRegion: The number of cache nodes in each SchemeRegion of a node
- MLog Length and Checkpoint: The total length and checkpoint position of the current mlog for each SchemeRegion of the node (valid only for SimpleConsense)
- Buffer MNode per SchemaRegion: The number of buffer nodes in each SchemeRegion of a node
- Activated Template Count per SchemaRegion: The number of activated templates in each SchemeRegion of a node
- Time Series statistics
- Timeseries Count per SchemaRegion: The average number of time series for node SchemaRegion
- Series Type: Number of time series of different types of nodes
- Time Series Number: The total number of time series nodes
- Template Series Number: The total number of template time series for nodes
- Template Series Count per SchemaRegion: The number of sequences created through templates in each SchemeRegion of a node
- IMNode Statistics
- Pinned MNode per SchemaRegion: Number of IMNode nodes with Pinned nodes in each SchemeRegion
- Pinned Memory per SchemaRegion: The memory usage size of the IMNode node for Pinned nodes in each SchemeRegion of the node
- Unpinned MNode per SchemaRegion: The number of unpinned IMNode nodes in each SchemeRegion of a node
- Unpinned Memory per SchemaRegion: Memory usage size of unpinned IMNode nodes in each SchemeRegion of the node
- Schema File Memory MNode Number: Number of IMNode nodes with global pinned and unpinned nodes
- Release and Flush MNode Rate: The number of IMNodes that release and flush nodes per second
- Cache Hit Rate: Cache hit rate of nodes
- Release and Flush Thread Number: The current number of active Release and Flush threads on the node
- Time Consumed of Relead and Flush (avg): The average time taken for node triggered cache release and buffer flushing
- Time Consumed of Relead and Flush (99%): P99 time consumption for node triggered cache release and buffer flushing
Query Engine
- Time Consumption In Each Stage
- Average Query Plan Execution Time: The average time spent on node queries at each stage
- P50 Query Plan Execution Time: Median time spent on node queries at each stage
- P99 Query Plan Execution Time: P99 time consumption for node query at each stage
- Execution Plan Distribution Time
- Average Query Plan Dispatch Time: The average time spent on node query execution plan distribution
- P50 Query Plan Dispatch Time: Median time spent on node query execution plan distribution
- P99 Query Plan Dispatch Time: P99 of node query execution plan distribution time
- Execution Plan Execution Time
- Average Query Execution Time: The average execution time of node query execution plan
- P50 Query Execution Time:Median execution time of node query execution plan
- P99 Query Execution Time: P99 of node query execution plan execution time
- Operator Execution Time
- Average Query Operator Execution Time: The average execution time of node query operators
- P50 Query Operator Execution Time: Median execution time of node query operator
- P99 Query Operator Execution Time: P99 of node query operator execution time
- Aggregation Query Computation Time
- Average Query Aggregation Execution Time: The average computation time for node aggregation queries
- P50 Query Aggregation Execution Time: Median computation time for node aggregation queries
- P99 Query Aggregation Execution Time: P99 of node aggregation query computation time
- File/Memory Interface Time Consumption
- Average Query Scan Execution Time: The average time spent querying file/memory interfaces for nodes
- P50 Query Scan Execution Time: Median time spent querying file/memory interfaces for nodes
- P99 Query Scan Execution Time: P99 time consumption for node query file/memory interface
- Number Of Resource Visits
- Average Query Resource Utilization: The average number of resource visits for node queries
- P50 Query Resource Utilization: Median number of resource visits for node queries
- P99 Query Resource Utilization: P99 for node query resource access quantity
- Data Transmission Time
- Average Query Data Exchange Latency: The average time spent on node query data transmission
- P50 Query Data Exchange Latency: Median query data transmission time for nodes
- P99 Query Data Exchange Latency: P99 for node query data transmission time
- Number Of Data Transfers
- Average Query Data Exchange Count: The average number of data transfers queried by nodes
- Query Data Exchange Count: The quantile of the number of data transfers queried by nodes, including the median and P99
- Task Scheduling Quantity And Time Consumption
- Query Queue Length: Node query task scheduling quantity
- Average Query Scheduling Latency: The average time spent on scheduling node query tasks
- P50 Query Scheduling Latency: Median time spent on node query task scheduling
- P99 Query Scheduling Latency: P99 of node query task scheduling time
Query Interface
- Load Time Series Metadata
- Average Timeseries Metadata Load Time: The average time taken for node queries to load time series metadata
- P50 Timeseries Metadata Load Time: Median time spent on loading time series metadata for node queries
- P99 Timeseries Metadata Load Time: P99 time consumption for node query loading time series metadata
- Read Time Series
- Average Timeseries Metadata Read Time: The average time taken for node queries to read time series
- P50 Timeseries Metadata Read Time: The median time taken for node queries to read time series
- P99 Timeseries Metadata Read Time: P99 time consumption for node query reading time series
- Modify Time Series Metadata
- Average Timeseries Metadata Modification Time:The average time taken for node queries to modify time series metadata
- P50 Timeseries Metadata Modification Time: Median time spent on querying and modifying time series metadata for nodes
- P99 Timeseries Metadata Modification Time: P99 time consumption for node query and modification of time series metadata
- Load Chunk Metadata List
- Average Chunk Metadata List Load Time: The average time it takes for node queries to load Chunk metadata lists
- P50 Chunk Metadata List Load Time: Median time spent on node query loading Chunk metadata list
- P99 Chunk Metadata List Load Time: P99 time consumption for node query loading Chunk metadata list
- Modify Chunk Metadata
- Average Chunk Metadata Modification Time: The average time it takes for node queries to modify Chunk metadata
- P50 Chunk Metadata Modification Time: The total number of bits spent on modifying Chunk metadata for node queries
- P99 Chunk Metadata Modification Time: P99 time consumption for node query and modification of Chunk metadata
- Filter According To Chunk Metadata
- Average Chunk Metadata Filtering Time: The average time spent on node queries filtering by Chunk metadata
- P50 Chunk Metadata Filtering Time: Median filtering time for node queries based on Chunk metadata
- P99 Chunk Metadata Filtering Time: P99 time consumption for node query filtering based on Chunk metadata
- Constructing Chunk Reader
- Average Chunk Reader Construction Time: The average time spent on constructing Chunk Reader for node queries
- P50 Chunk Reader Construction Time: Median time spent on constructing Chunk Reader for node queries
- P99 Chunk Reader Construction Time: P99 time consumption for constructing Chunk Reader for node queries
- Read Chunk
- Average Chunk Read Time: The average time taken for node queries to read Chunks
- P50 Chunk Read Time: Median time spent querying nodes to read Chunks
- P99 Chunk Read Time: P99 time spent on querying and reading Chunks for nodes
- Initialize Chunk Reader
- Average Chunk Reader Initialization Time: The average time spent initializing Chunk Reader for node queries
- P50 Chunk Reader Initialization Time: Median time spent initializing Chunk Reader for node queries
- P99 Chunk Reader Initialization Time:P99 time spent initializing Chunk Reader for node queries
- Constructing TsBlock Through Page Reader
- Average TsBlock Construction Time from Page Reader: The average time it takes for node queries to construct TsBlock through Page Reader
- P50 TsBlock Construction Time from Page Reader: The median time spent on constructing TsBlock through Page Reader for node queries
- P99 TsBlock Construction Time from Page Reader:Node query using Page Reader to construct TsBlock time-consuming P99
- Query the construction of TsBlock through Merge Reader
- Average TsBlock Construction Time from Merge Reader: The average time taken for node queries to construct TsBlock through Merge Reader
- P50 TsBlock Construction Time from Merge Reader: The median time spent on constructing TsBlock through Merge Reader for node queries
- P99 TsBlock Construction Time from Merge Reader: Node query using Merge Reader to construct TsBlock time-consuming P99
Query Data Exchange
The data exchange for the query is time-consuming.
- Obtain TsBlock through source handle
- Average Source Handle TsBlock Retrieval Time: The average time taken for node queries to obtain TsBlock through source handle
- P50 Source Handle TsBlock Retrieval Time:Node query obtains the median time spent on TsBlock through source handle
- P99 Source Handle TsBlock Retrieval Time: Node query obtains TsBlock time P99 through source handle
- Deserialize TsBlock through source handle
- Average Source Handle TsBlock Deserialization Time: The average time taken for node queries to deserialize TsBlock through source handle
- P50 Source Handle TsBlock Deserialization Time: The median time taken for node queries to deserialize TsBlock through source handle
- P99 Source Handle TsBlock Deserialization Time: P99 time spent on deserializing TsBlock through source handle for node query
- Send TsBlock through sink handle
- Average Sink Handle TsBlock Transmission Time: The average time taken for node queries to send TsBlock through sink handle
- P50 Sink Handle TsBlock Transmission Time: Node query median time spent sending TsBlock through sink handle
- P99 Sink Handle TsBlock Transmission Time: Node query sends TsBlock through sink handle with a time consumption of P99
- Callback data block event
- Average Data Block Event Acknowledgment Time: The average time taken for node query callback data block event
- P50 Data Block Event Acknowledgment Time: Median time spent on node query callback data block event
- P99 Data Block Event Acknowledgment Time: P99 time consumption for node query callback data block event
- Get Data Block Tasks
- Average Data Block Task Retrieval Time: The average time taken for node queries to obtain data block tasks
- P50 Data Block Task Retrieval Time: The median time taken for node queries to obtain data block tasks
- P99 Data Block Task Retrieval Time: P99 time consumption for node query to obtain data block task
Query Related Resource
- MppDataExchangeManager:The number of shuffle sink handles and source handles during node queries
- LocalExecutionPlanner: The remaining memory that nodes can allocate to query shards
- FragmentInstanceManager: The query sharding context information and the number of query shards that the node is running
- Coordinator: The number of queries recorded on the node
- MemoryPool Size: Node query related memory pool situation
- MemoryPool Capacity: The size of memory pools related to node queries, including maximum and remaining available values
- DriverScheduler Count: Number of queue tasks related to node queries
Consensus - IoT Consensus
- Memory Usage
- IoTConsensus Used Memory: The memory usage of IoT Consumes for nodes, including total memory usage, queue usage, and synchronization usage
- Synchronization Status Between Nodes
- IoTConsensus Sync Index Size: SyncIndex size for different DataRegions of IoT Consumption nodes
- IoTConsensus Overview:The total synchronization gap and cached request count of IoT consumption for nodes
- IoTConsensus Search Index Growth Rate: The growth rate of writing SearchIndex for different DataRegions of IoT Consumer nodes
- IoTConsensus Safe Index Growth Rate: The growth rate of synchronous SafeIndex for different DataRegions of IoT Consumer nodes
- IoTConsensus LogDispatcher Request Size: The request size for node IoT Consusus to synchronize different DataRegions to other nodes
- Sync Lag: The size of synchronization gap between different DataRegions in IoT Consumption node
- Min Peer Sync Lag: The minimum synchronization gap between different DataRegions and different replicas of node IoT Consumption
- Peer Sync Speed Difference: The maximum difference in synchronization from different DataRegions to different replicas for node IoT Consumption
- IoTConsensus LogEntriesFromWAL Rate: The rate at which nodes IoT Consumus obtain logs from WAL for different DataRegions
- IoTConsensus LogEntriesFromQueue Rate: The rate at which nodes IoT Consumes different DataRegions retrieve logs from the queue
- Different Execution Stages Take Time
- The Time Consumed of Different Stages (avg): The average time spent on different execution stages of node IoT Consumus
- The Time Consumed of Different Stages (50%): The median time spent on different execution stages of node IoT Consusus
- The Time Consumed of Different Stages (99%):P99 of the time consumption for different execution stages of node IoT Consusus
Consensus - DataRegion Ratis Consensus
- Ratis Consensus Stage Latency: The time consumption of different stages of node Ratis
- Ratis Log Write Latency: The time consumption of writing logs at different stages of node Ratis
- Remote / Local Write Latency: The time it takes for node Ratis to write locally or remotely
- Remote / Local Write Throughput(QPS): QPS written by node Ratis locally or remotely
- RatisConsensus Memory Usage:Memory usage of node Ratis
Consensus - SchemaRegion Ratis Consensus
- RatisConsensus Stage Latency: The time consumption of different stages of node Ratis
- Ratis Log Write Latency: The time consumption for writing logs at each stage of node Ratis
- Remote / Local Write Latency: The time it takes for node Ratis to write locally or remotelyThe time it takes for node Ratis to write locally or remotely
- Remote / Local Write Throughput(QPS): QPS written by node Ratis locally or remotely
- RatisConsensus Memory Usage: Node Ratis Memory Usage