Benchmark Tool
Benchmark Tool
IoT-benchmark is a time-series database benchmarking tool based on Java and big data environment, developed and open sourced by School of Software Tsinghua University. It is easy to use, supports multiple writing and query methods, supports storing test information and results for further query or analysis, and supports integration with Tableau to visualize test results.
Figure 1-1 below includes the test benchmark process and other extended functions. These processes can be unified by IoT-benchmark. IoT Benchmark supports a variety of workloads, including pure write, pure query, write query mixed, etc., supports software and hardware system monitoring, test metric measurement and other monitoring functions, and also realizes initializing the database automatically, test data analysis and system parameter optimization functions.
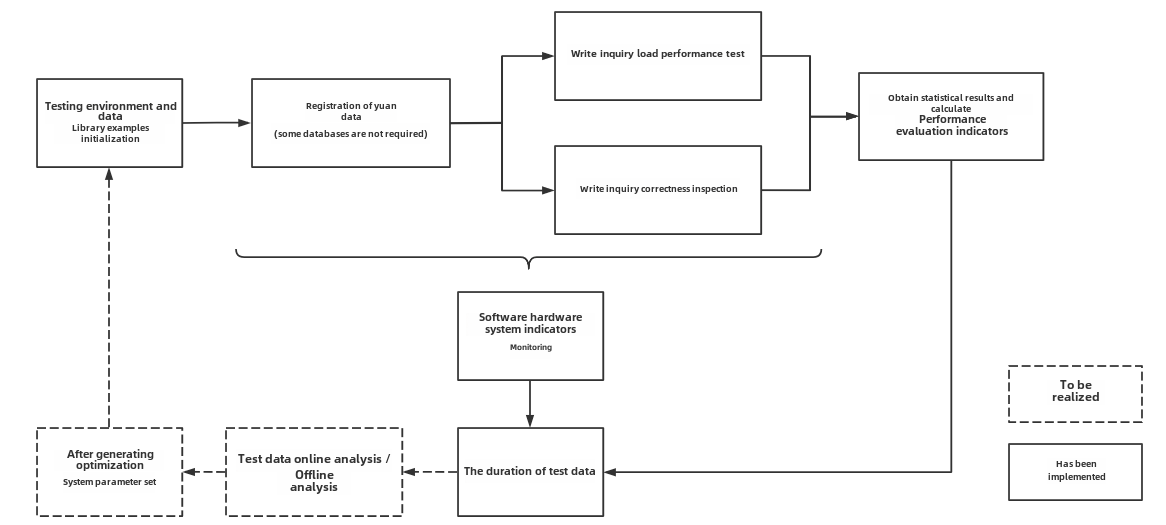
Figure 1-1
Referring to the YCSB test tool's design idea of separating the three components of workload generation, performance metric measurement and database interface, the modular design of IoT-benchmark is shown in Figure 1-2. Different from the YCSB-based test tool system, IoT-benchmark adds a system monitoring module to support the persistence of test data and system monitoring data. In addition, some special load testing functions especially designed for time series data scenarios have been added, such as supporting batch writing and multiple out-of-sequence data writing modes for IoT scenarios.
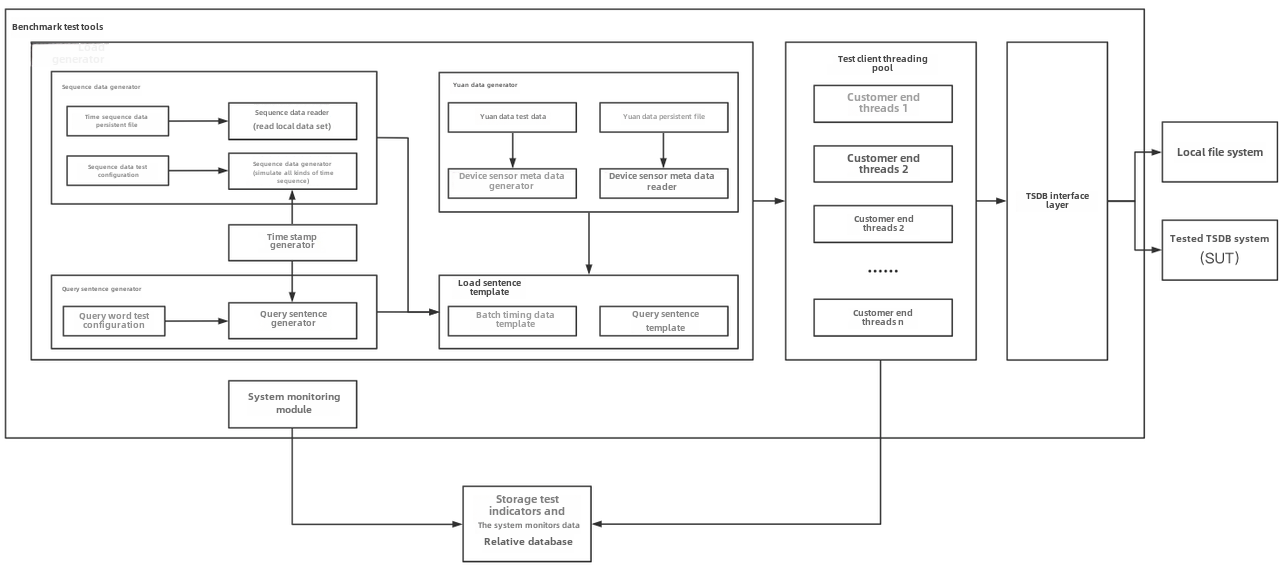
Figure 1-2
Currently IoT-benchmark supports the following time series databases, versions and connection methods:
| Database | Version | Connection mmethod |
|---|---|---|
| InfluxDB | v1.x v2.0 | SDK |
| TimescaleDB | -- | jdbc |
| OpenTSDB | -- | Http Request |
| QuestDB | v6.0.7 | jdbc |
| TDengine | v2.2.0.2 | jdbc |
| VictoriaMetrics | v1.64.0 | Http Request |
| KairosDB | -- | Http Request |
| IoTDB | v1.x v0.13 | jdbc、sessionByTablet、sessionByRecord、sessionByRecords |
Table 1-1 Comparison of big data test benchmarks
Software Installation and Environment Setup
Prerequisites
- Java 8
- Maven 3.6+
- The corresponding appropriate version of the database, such as Apache IoTDB 1.0
How to Get IoT Benchmark
- Get the binary package: Enter https://github.com/thulab/iot-benchmark/releases to download the required installation package. Download it as a compressed file, select a folder to decompress and use it.
- Compiled from source (can be tested with Apache IoTDB 1.0):
- The first step (compile the latest IoTDB Session package): Enter the official website https://github.com/apache/iotdb/tree/rel/1.0 to download the IoTDB source code, and run the command
mvn clean package install -pl session -am -DskipTestsin the root directory to compiles the latest package for IoTDB Session. - The second step (compile the IoTDB Benchmark test package): Enter the official website https://github.com/thulab/iot-benchmark to download the source code, run
mvn clean package install -pl iotdb-1.0 -am -DskipTestsin the root directory to compile Apache IoTDB version 1.0 test package. The relative path between the test package and the root directory is./iotdb-1.0/target/iotdb-1.0-0.0.1/iotdb-1.0-0.0.1.
- The first step (compile the latest IoTDB Session package): Enter the official website https://github.com/apache/iotdb/tree/rel/1.0 to download the IoTDB source code, and run the command
IoT Benchmark's Test Package Structure
The directory structure of the test package is shown in Figure 1-3 below. The test configuration file is conf/config.properties, and the test startup scripts are benchmark.sh (Linux & MacOS) and benchmark.bat (Windows). The detailed usage of the files is shown in Table 1-2.

Figure 1-3 List of files and folders
| Name | File | Usage |
|---|---|---|
| benchmark.bat | - | Startup script on Windows |
| benchmark.sh | - | Startup script on Linux/Mac |
| conf | config.properties | Test scenario configuration file |
| logback.xml | - | Log output configuration file |
| lib | - | Dependency library |
| LICENSE | - | License file |
| bin | startup.sh | Init script folder |
| ser-benchmark.sh | - | Monitor mode startup script |
Table 1-2 Usage list of files and folders
IoT Benchmark Execution Test
- Modify the configuration file according to the test requirements. For the main parameters, see next chapter. The corresponding configuration file is conf/config.properties. For example, to test Apache IoTDB 1.0, you need to modify DB_SWITCH=IoTDB-100-SESSION_BY_TABLET.
- Start the time series database under test.
- Running.
- Start IoT-benchmark to execute the test. Observe the status of the time series database and IoT-benchmark under test during execution, and view the results and analyze the test process after execution.
IoT Benchmark Results Interpretation
All the log files of the test are stored in the logs folder, and the test results are stored in the data/csvOutput folder after the test is completed. For example, after the test, we get the following result matrix:
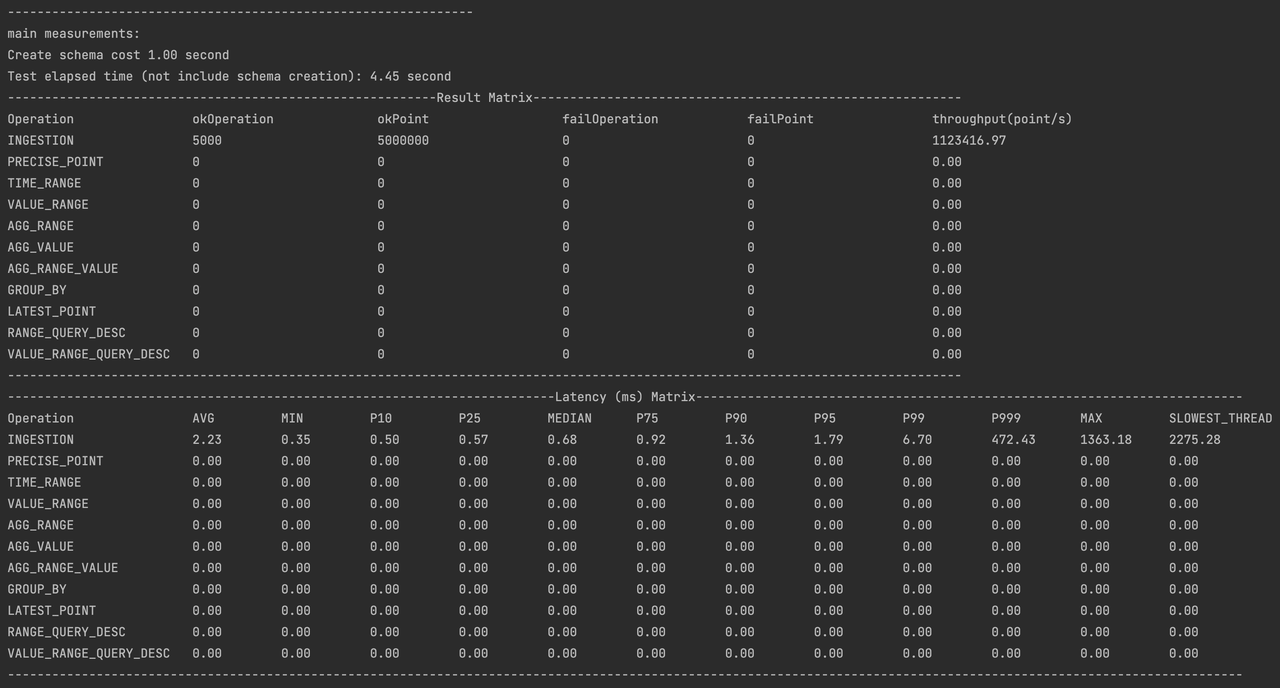
- Result Matrix
- OkOperation: successful operations
- OkPoint: For write operations, it is the number of points successfully written; for query operations, it is the number of points successfully queried.
- FailOperation: failed operations
- FailPoint: For write operations, it is the number of write failure points
- Latency(mx) Matrix
- AVG: average operation time
- MIN: minimum operation time
- Pn: the quantile value of the overall distribution of operations, for example, P25 is the lower quartile.
Main Parameters
This chapter mainly explains the purpose and configuration method of the main parameters.
Working Mode and Operation Proportion
The working mode parameter "BENCHMARK_WORK_MODE" can be selected as "default mode" and "server monitoring"; the "server monitoring" mode can be started directly by executing the ser-benchmark.sh script, and the script will automatically modify this parameter. "Default mode" is a commonly used test mode, combined with the configuration of the OPERATION_PROPORTION parameter to achieve the definition of test operation proportions of "pure write", "pure query" and "read-write mix".
When running ServerMode to monitor the operating environment of the time series database under test, IoT-benchmark relies on sysstat software related commands; if MySQL or IoTDB is selected for persistent test process data, this type of database needs to be installed; the recording mode of ServerMode and CSV can only be used in the Linux system to record relevant system information during the test. Therefore, we recommend using MacOs or Linux system. This article uses Linux (Centos7) system as an example. If you use Windows system, you can use the benchmark.bat script in the conf folder to start IoT-benchmark.
Table 1-3 Test mode
| Mode Name | BENCHMARK_WORK_MODE | Description |
|---|---|---|
| default mode | testWithDefaultPath | Supports mixed workloads with multiple read and write operations |
| server mode | serverMODE | Server resource usage monitoring mode (running in this mode is started by the ser-benchmark.sh script, no need to manually configure this parameter) |
Server Connection Information
After the working mode is specified, how to inform IoT-benchmark of the information of the time series database under test? Currently, the type of the time-series database under test is informed through "DB_SWITCH"; the network address of the time-series database under test is informed through "HOST"; the network port of the time-series database under test is informed through "PORT"; the login user name of the time-series database under test is informed through "USERNAME"; "PASSWORD" informs the password of the login user of the time series database under test; informs the name of the time series database under test through "DB_NAME"; informs the connection authentication token of the time series database under test through "TOKEN" (used by InfluxDB 2.0).
Write Scene Setup Parameters
Table 1-4 Write scene setup parameters
| Parameter Name | Type | Example | Description |
|---|---|---|---|
| CLIENT_NUMBER | Integer | 100 | Total number of clients |
| GROUP_NUMBER | Integer | 20 | Number of storage groups; only for IoTDB. |
| DEVICE_NUMBER | Integer | 100 | Total number of devices |
| SENSOR_NUMBER | Integer | 300 | Total number of sensors per device |
| INSERT_DATATYPE_PROPORTION | String | 1:1:1:1:1:1 | the data type proportion of the device, BOOLEAN:INT32:INT64:FLOAT:DOUBLE:TEXT |
| POINT_STEP | Integer | 1000 | Timestamp interval, that is, the fixed length between two timestamps of generated data. |
| OP_MIN_INTERVAL | Integer | 0 | Minimum operation execution interval: if the operation time is greater than this value, execute the next one immediately, otherwise wait (OP_MIN_INTERVAL-actual execution time) ms; if it is 0, the parameter will not take effect; if it is -1, its value is consistent with POINT_STEP. |
| IS_OUT_OF_ORDER | Boolean | false | Whether to write out of order |
| OUT_OF_ORDER_RATIO | Float | 0.3 | Ratio of data written out of order |
| BATCH_SIZE_PER_WRITE | Integer | 1 | Number of data rows written in batches (how many rows of data are written at a time) |
| START_TIME | Timestamp | 2022-10-30T00:00:00+08:00 | The start timestamp of writing data; use this timestamp as the starting point to start the simulation to create the data timestamp. |
| LOOP | Integer | 86400 | Total number of operations: Each type of operation will be divided according to the ratio defined by OPERATION_PROPORTION |
| OPERATION_PROPORTION | String | 1:0:0:0:0:0:0:0:0:0:0 | The ratio of each operation. Write:Q1:Q2:Q3:Q4:Q5:Q6:Q7:Q8:Q9:Q10, please note the use of English colons. Each term in the scale is an integer. |
According to the configuration parameters in Table 1-4, the test scenario can be described as follows: write 30,000 (100 devices, 300 sensors for each device) time series sequential data for a day on October 30, 2022 to the time series database under test, in total 2.592 billion data points. The 300 sensor data types of each device are 50 Booleans, 50 integers, 50 long integers, 50 floats, 50 doubles, and 50 characters. If we change the value of IS_OUT_OF_ORDER in the table to true, then the scenario is: write 30,000 time series data on October 30, 2022 to the measured time series database, and there are 30% out of order data ( arrives in the time series database later than other data points whose generation time is later than itself).
Query Scene Setup Parameters
Table 1-5 Query scene setup parameters
| Parameter Name | Type | Example | Description |
|---|---|---|---|
| QUERY_DEVICE_NUM | Integer | 2 | The number of devices involved in the query in each query statement. |
| QUERY_SENSOR_NUM | Integer | 2 | The number of sensors involved in the query in each query statement. |
| QUERY_AGGREGATE_FUN | String | count | Aggregate functions used in aggregate queries, such as count, avg, sum, max_time, etc. |
| STEP_SIZE | Integer | 1 | The change step of the starting time point of the time filter condition, if set to 0, the time filter condition of each query is the same, unit: POINT_STEP. |
| QUERY_INTERVAL | Integer | 250000 | The time interval between the start time and the end time in the start and end time query, and the time interval in Group By. |
| QUERY_LOWER_VALUE | Integer | -5 | Parameters for conditional query clauses, where xxx > QUERY_LOWER_VALUE. |
| GROUP_BY_TIME_UNIT | Integer | 20000 | The size of the group in the Group By statement. |
| LOOP | Integer | 10 | Total number of operations. Each type of operation will be divided according to the ratio defined by OPERATION_PROPORTION. |
| OPERATION_PROPORTION | String | 0:0:0:0:0:0:0:0:0:0:1 | Write:Q1:Q2:Q3:Q4:Q5:Q6:Q7:Q8:Q9:Q10 |
Table 1-6 Query types and example SQL
| Id | Query Type | IoTDB Example SQL |
|---|---|---|
| Q1 | exact point query | select v1 from root.db.d1 where time = ? |
| Q2 | time range query | select v1 from root.db.d1 where time > ? and time < ? |
| Q3 | time range query with value filtering | select v1 from root.db.d1 where time > ? and time < ? and v1 > ? |
| Q4 | time range aggregation query | select count(v1) from root.db.d1 where and time > ? and time < ? |
| Q5 | full time range aggregate query with value filtering | select count(v1) from root.db.d1 where v1 > ? |
| Q6 | time range aggregation query with value filtering | select count(v1) from root.db.d1 where v1 > ? and time > ? and time < ? |
| Q7 | time grouping aggregation query | select count(v1) from root.db.d1 group by ([?, ?), ?, ?) |
| Q8 | latest point query | select last v1 from root.db.d1 |
| Q9 | reverse order time range query | select v1 from root.sg.d1 where time > ? and time < ? order by time desc |
| Q10 | reverse order time range query with value filtering | select v1 from root.sg.d1 where time > ? and time < ? and v1 > ? order by time desc |
According to the configuration parameters in Table 1-5, the test scenario can be described as follows: Execute 10 reverse order time range queries with value filtering for 2 devices and 2 sensors from the time series database under test. The SQL statement is: select s_0,s_31from data where time >2022-10-30T00:00:00+08:00 and time < 2022-10-30T00:04:10+08:00 and s_0 > -5 and device in d_21,d_46 order by time desc.
Persistence of Test Process and Test Results
IoT-benchmark currently supports persisting the test process and test results to IoTDB, MySQL, and CSV through the configuration parameter "TEST_DATA_PERSISTENCE"; writing to MySQL and CSV can define the upper limit of the number of rows in the sub-database and sub-table, such as "RECORD_SPLIT=true, RECORD_SPLIT_MAX_LINE=10000000" means that each database table or CSV file is divided and stored according to the total number of 10 million rows; if the records are recorded to MySQL or IoTDB, database link information needs to be provided, including "TEST_DATA_STORE_IP" the IP address of the database, "TEST_DATA_STORE_PORT" the port number of the database, "TEST_DATA_STORE_DB" the name of the database, "TEST_DATA_STORE_USER" the database user name, and "TEST_DATA_STORE_PW" the database user password.
If we set "TEST_DATA_PERSISTENCE=CSV", we can see the newly generated data folder under the IoT-benchmark root directory during and after the test execution, which contains the csv folder to record the test process; the csvOutput folder to record the test results . If we set "TEST_DATA_PERSISTENCE=MySQL", it will create a data table named "testWithDefaultPath_tested database name_remarks_test start time" in the specified MySQL database before the test starts to record the test process; it will record the test process in the "CONFIG" data table (create the table if it does not exist), write the configuration information of this test; when the test is completed, the result of this test will be written in the data table named "FINAL_RESULT" (create the table if it does not exist).
Use Case
We take the application of CRRC Qingdao Sifang Vehicle Research Institute Co., Ltd. as an example, and refer to the scene described in "Apache IoTDB in Intelligent Operation and Maintenance Platform Storage" for practical operation instructions.
Test objective: Simulate the actual needs of switching time series databases in the scene of CRRC Qingdao Sifang Institute, and compare the performance of the expected IoTDB and KairosDB used by the original system.
Test environment: In order to ensure that the impact of other irrelevant services and processes on database performance and the mutual influence between different databases are eliminated during the experiment, the local databases in this experiment are deployed and run on multiple independent virtual servers with the same resource configuration. Therefore, this experiment set up 4 Linux (CentOS7 /x86) virtual machines, and deployed IoT-benchmark, IoTDB database, KairosDB database, and MySQL database on them respectively. The specific resource configuration of each virtual machine is shown in Table 2-1. The specific usage of each virtual machine is shown in Table 2-2.
Table 2-1 Virtual machine configuration information
| Hardware Configuration Information | Value |
|---|---|
| OS system | CentOS7 |
| number of CPU cores | 16 |
| memory | 32G |
| hard disk | 200G |
| network | Gigabit |
Table 2-2 Virtual machine usage
| IP | Usage |
|---|---|
| 172.21.4.2 | IoT-benchmark |
| 172.21.4.3 | Apache-iotdb |
| 172.21.4.4 | KaiosDB |
| 172.21.4.5 | MySQL |
Write Test
Scenario description: Create 100 clients to simulate 100 trains, each train has 3000 sensors, the data type is DOUBLE, the data time interval is 500ms (2Hz), and they are sent sequentially. Referring to the above requirements, we need to modify the IoT-benchmark configuration parameters as listed in Table 2-3.
Table 2-3 Configuration parameter information
| Parameter Name | IoTDB Value | KairosDB Value |
|---|---|---|
| DB_SWITCH | IoTDB-013-SESSION_BY_TABLET | KairosDB |
| HOST | 172.21.4.3 | 172.21.4.4 |
| PORT | 6667 | 8080 |
| BENCHMARK_WORK_MODE | testWithDefaultPath | |
| OPERATION_PROPORTION | 1:0:0:0:0:0:0:0:0:0:0 | |
| CLIENT_NUMBER | 100 | |
| GROUP_NUMBER | 10 | |
| DEVICE_NUMBER | 100 | |
| SENSOR_NUMBER | 3000 | |
| INSERT_DATATYPE_PROPORTION | 0:0:0:0:1:0 | |
| POINT_STEP | 500 | |
| OP_MIN_INTERVAL | 0 | |
| IS_OUT_OF_ORDER | false | |
| BATCH_SIZE_PER_WRITE | 1 | |
| LOOP | 10000 | |
| TEST_DATA_PERSISTENCE | MySQL | |
| TEST_DATA_STORE_IP | 172.21.4.5 | |
| TEST_DATA_STORE_PORT | 3306 | |
| TEST_DATA_STORE_DB | demo | |
| TEST_DATA_STORE_USER | root | |
| TEST_DATA_STORE_PW | admin | |
| REMARK | demo |
First, start the tested time series databases Apache-IoTDB and KairosDB on 172.21.4.3 and 172.21.4.4 respectively, and then start server resource monitoring through the ser-benchamrk.sh script on 172.21.4.2, 172.21.4.3 and 172.21.4.4 (Figure 2-1). Then modify the conf/config.properties files in the iotdb-0.13-0.0.1 and kairosdb-0.0.1 folders in 172.21.4.2 according to Table 2-3 to meet the test requirements. Use benchmark.sh to start the writing test of Apache-IoTDB and KairosDB successively.
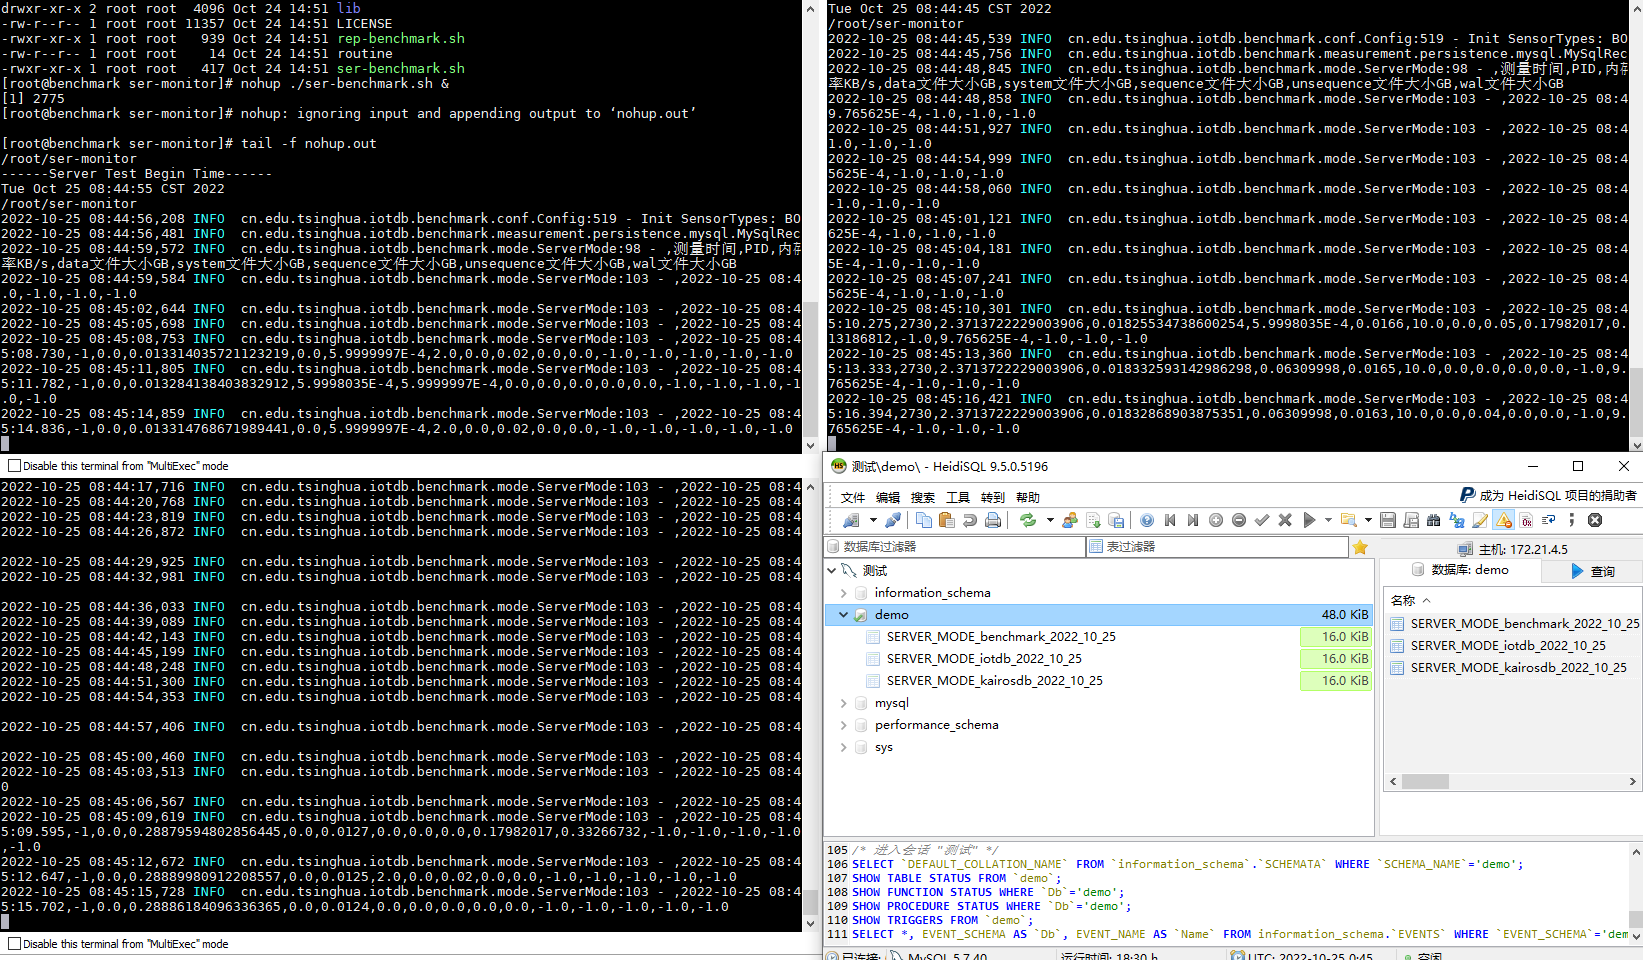
Figure 2-1 Server monitoring tasks
For example, if we first start the test on KairosDB, IoT-benchmark will create a CONFIG data table in the MySQL database to store the configuration information of this test (Figure 2-2), and there will be a log output of the current test progress during the test execution (Figure 2-3) . When the test is completed, the test result will be output (Figure 2-3), and the result will be written into the FINAL_RESULT data table (Figure 2-4).
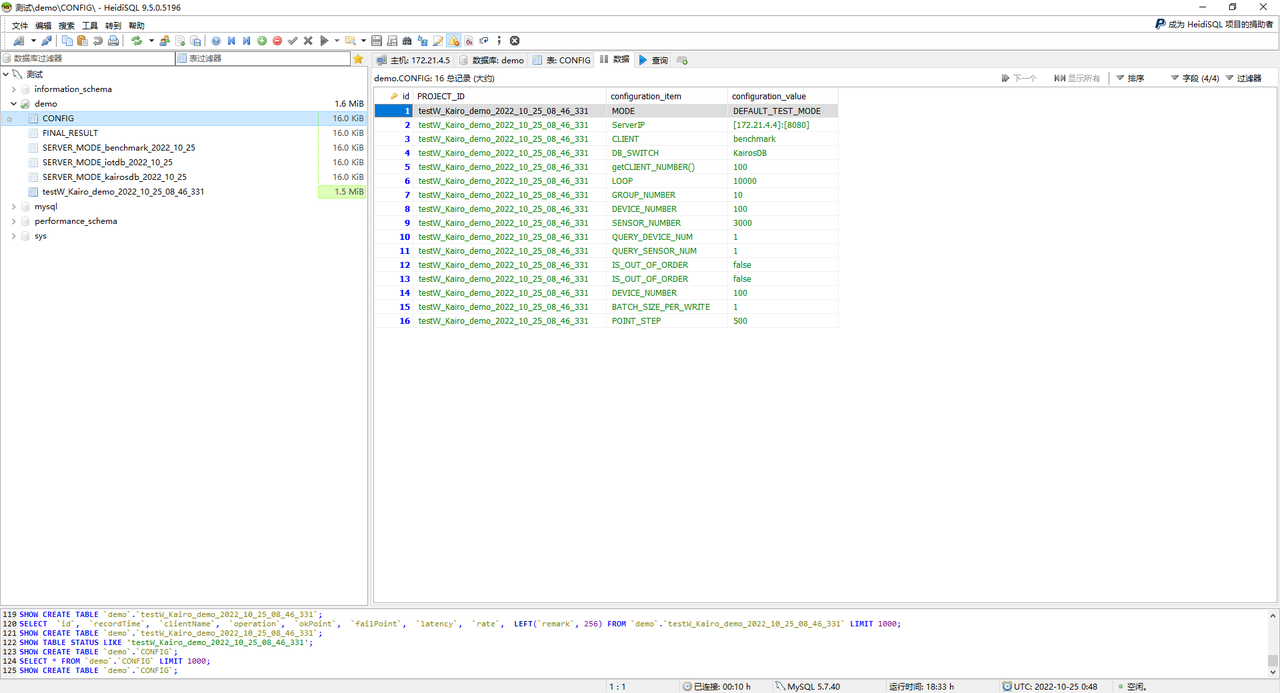
Figure 2-2 Test configuration information table
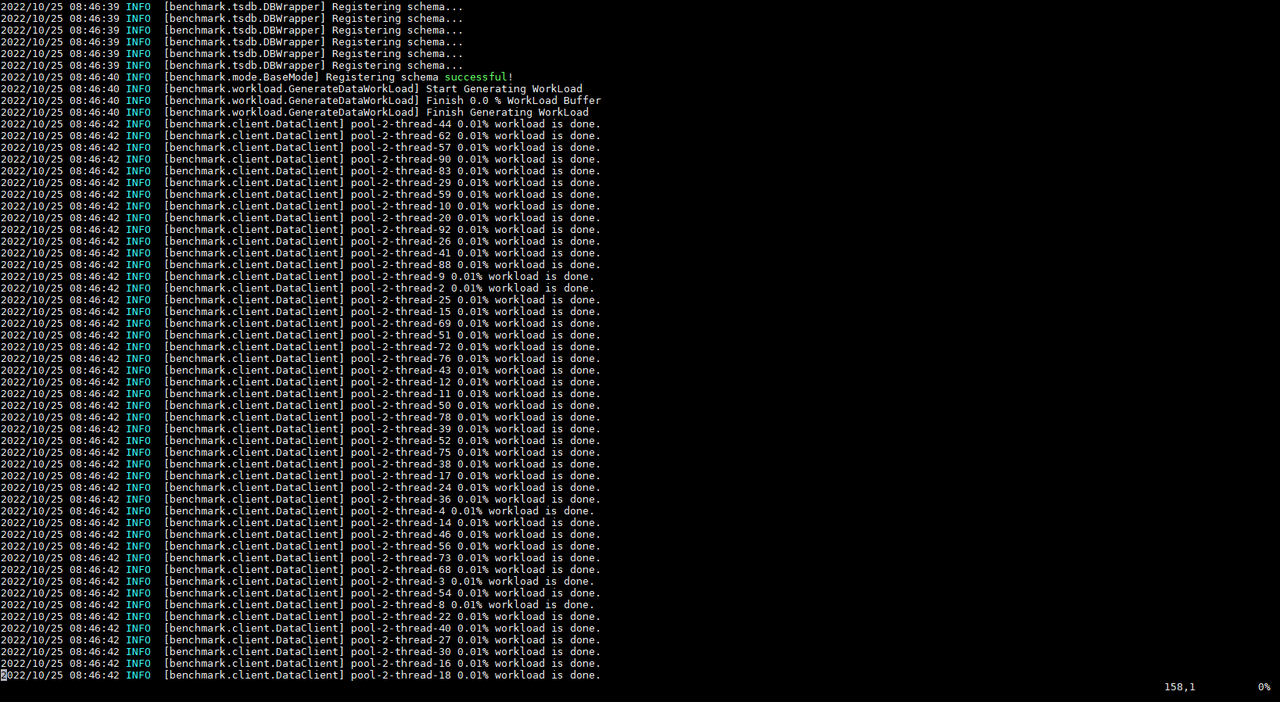
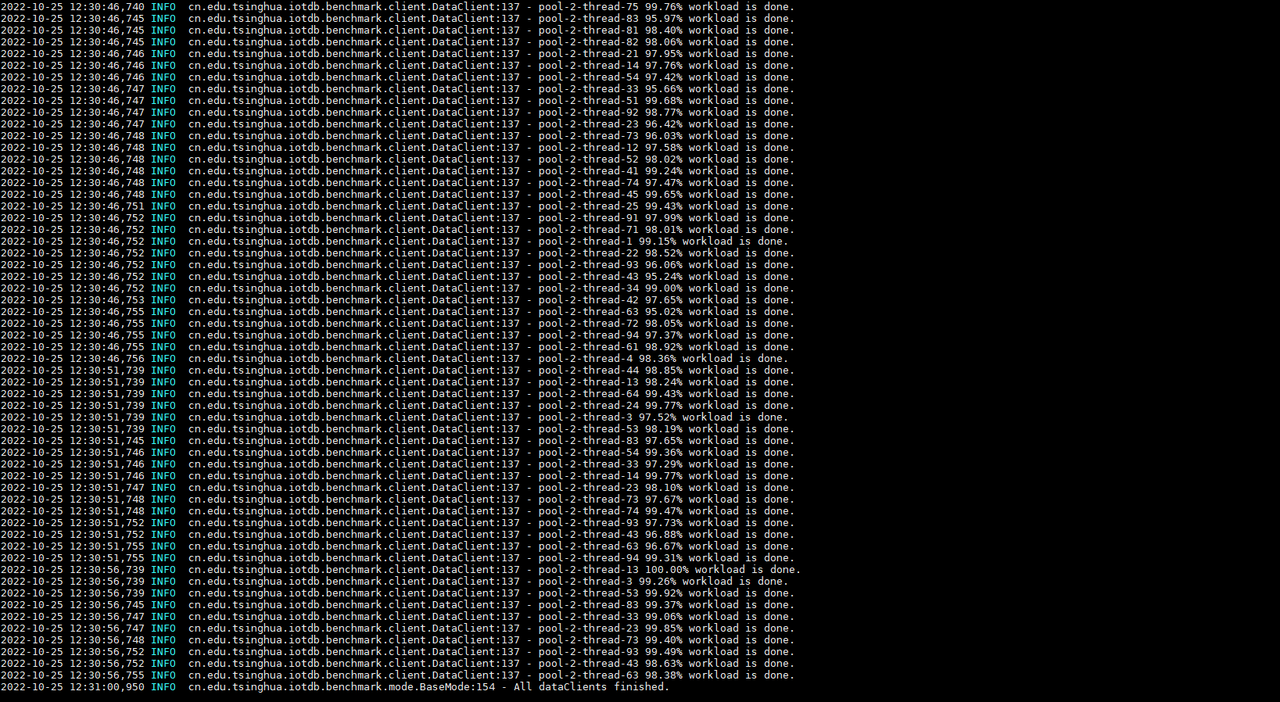
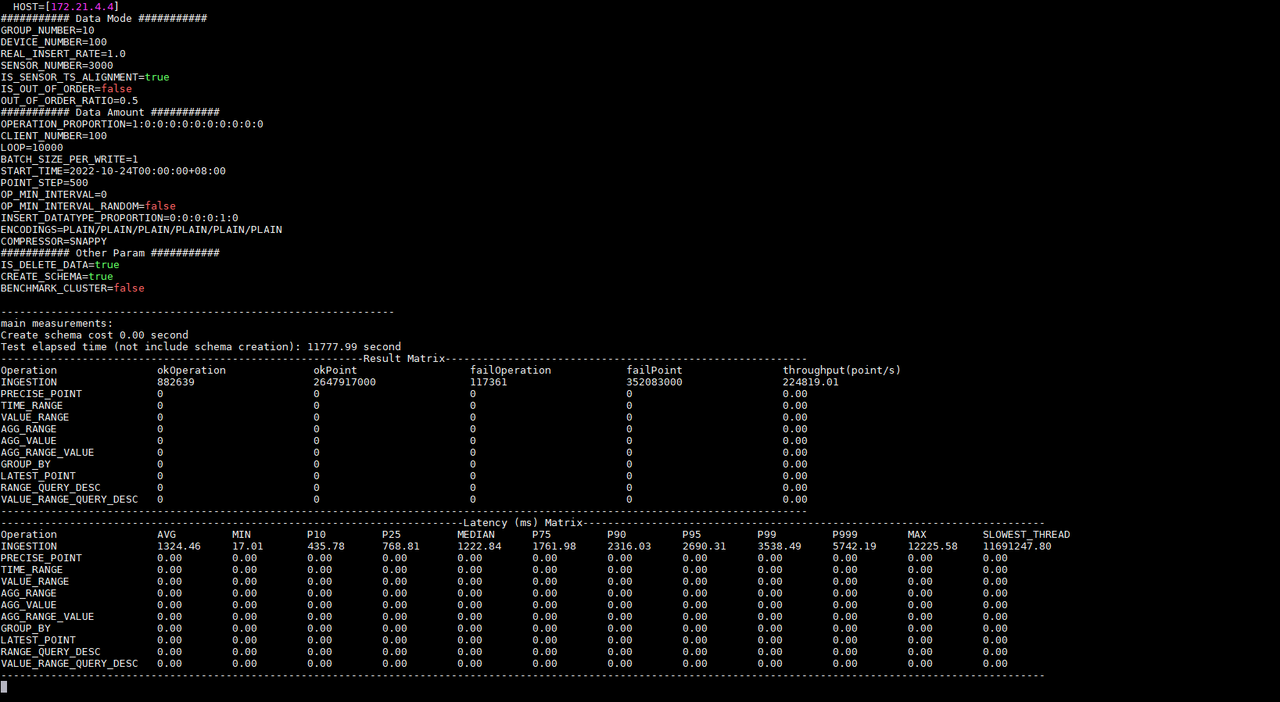
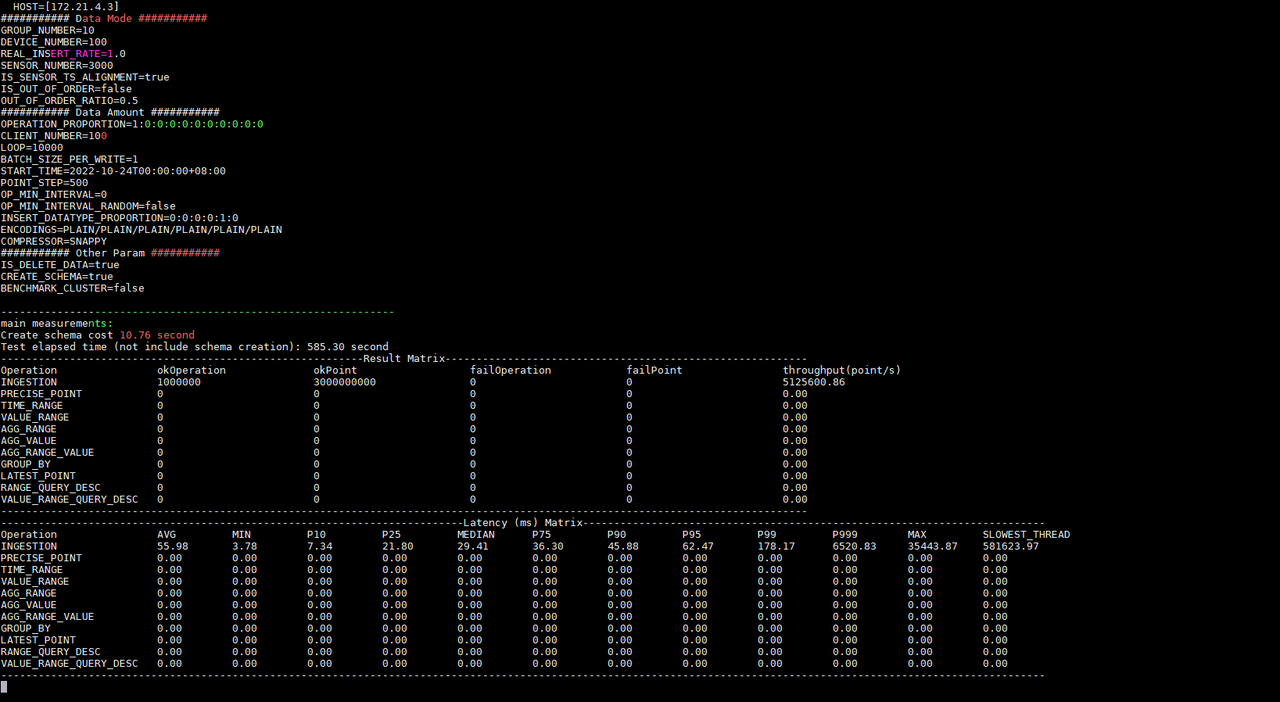
Figure 2-3 Test progress and results
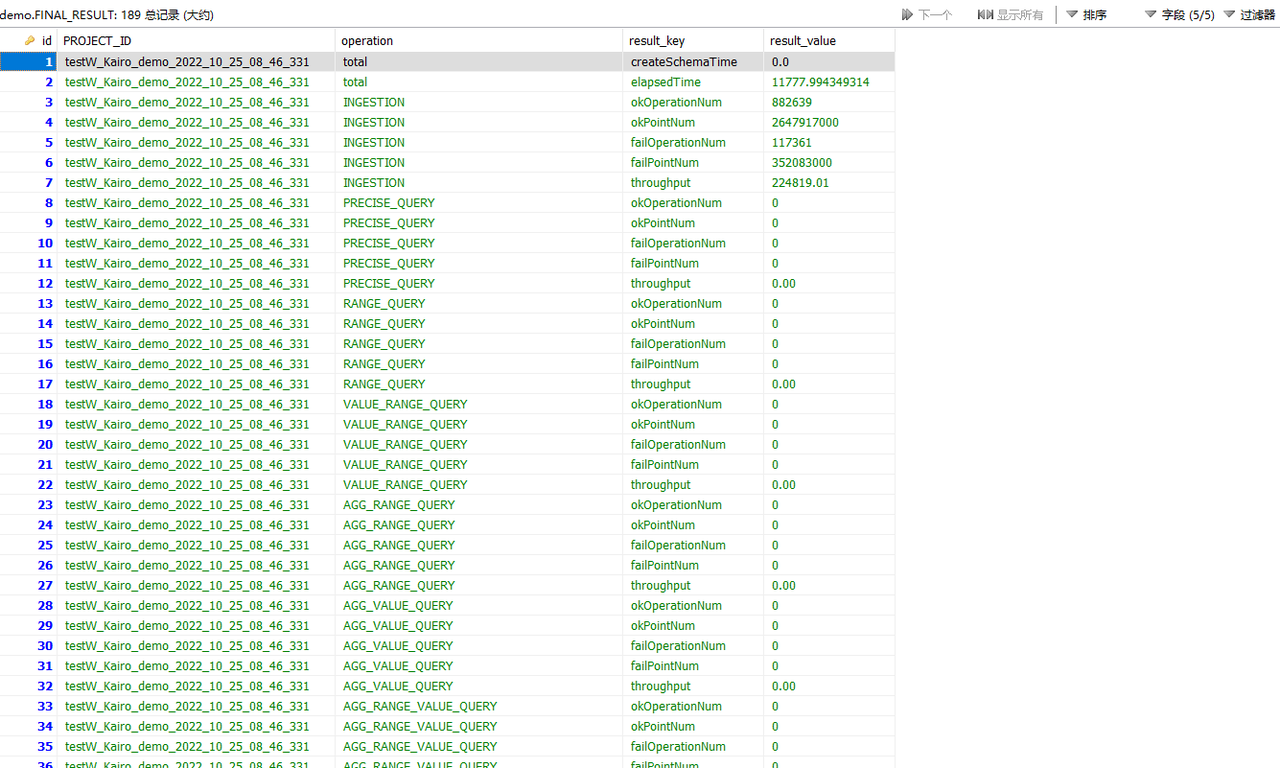
Figure 2-4 Test result table
Afterwards, we will start the test on Apache-IoTDB. The same IoT-benchmark will write the test configuration information in the MySQL database CONFIG data table. During the test execution, there will be a log to output the current test progress. When the test is completed, the test result will be output, and the result will be written into the FINAL_RESULT data table.
According to the test result information, we know that under the same configuration the write delay times of Apache-IoTDB and KairosDB are 55.98ms and 1324.45ms respectively; the write throughputs are 5,125,600.86 points/second and 224,819.01 points/second respectively; the tests were executed respectively 585.30 seconds and 11777.99 seconds. And KairosDB has a write failure. After investigation, it is found that the data disk usage has reached 100%, and there is no disk space to continue receiving data. However, Apache-IoTDB has no write failure, and the disk space occupied after all data is written is only 4.7G (as shown in Figure 2-5); Apache-IoTDB is better than KairosDB in terms of write throughput and disk occupation. Of course, there will be other tests in the follow-up to observe and compare from various aspects, such as query performance, file compression ratio, data security, etc.

Figure 2-5 Disk usage
So what is the resource usage of each server during the test? What is the specific performance of each write operation? At this time, we can visualize the data in the server monitoring table and test process recording table by installing and using Tableau. The use of Tableau will not be introduced in this article. After connecting to the data table for test data persistence, the specific results are as follows (taking Apache-IoTDB as an example):
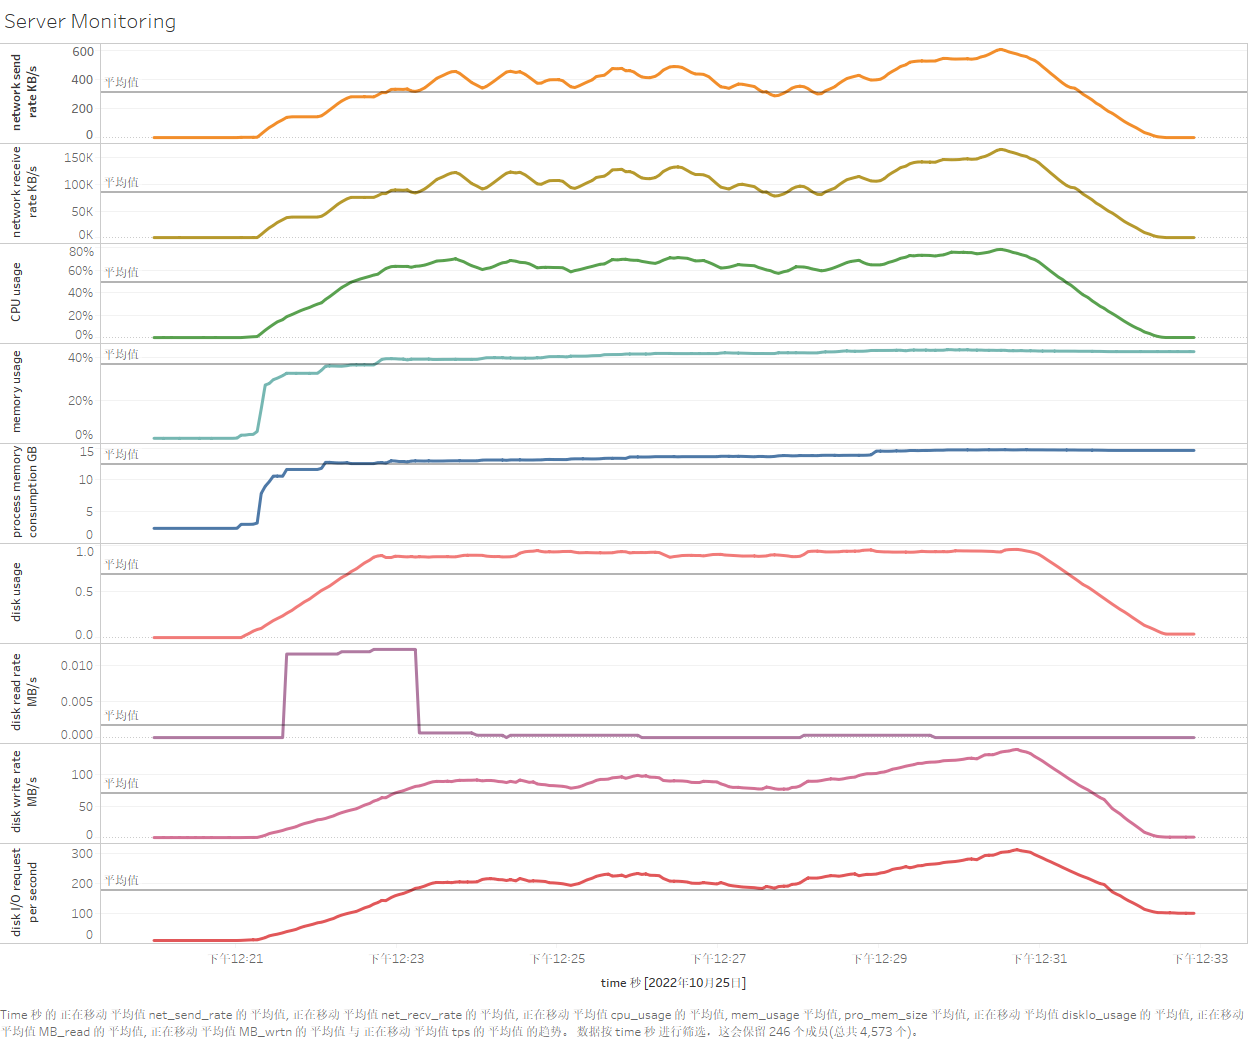
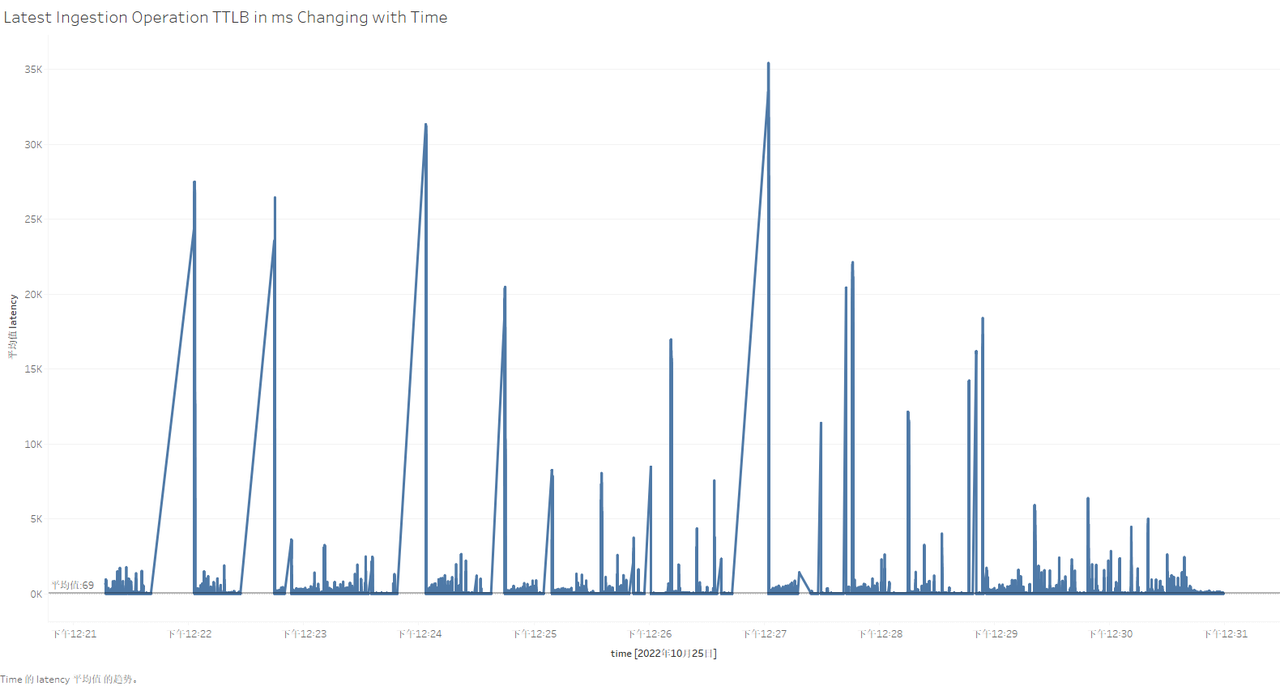
Figure 2-6 Visualization of testing process in Tableau
Query Test
Scenario description: In the writing test scenario, 10 clients are simulated to perform all types of query tasks on the data stored in the time series database Apache-IoTDB. The configuration is as follows.
Table 2-4 Configuration parameter information
| Parameter Name | Example |
|---|---|
| CLIENT_NUMBER | 10 |
| QUERY_DEVICE_NUM | 2 |
| QUERY_SENSOR_NUM | 2 |
| QUERY_AGGREGATE_FUN | count |
| STEP_SIZE | 1 |
| QUERY_INTERVAL | 250000 |
| QUERY_LOWER_VALUE | -5 |
| GROUP_BY_TIME_UNIT | 20000 |
| LOOP | 30 |
| OPERATION_PROPORTION | 0:1:1:1:1:1:1:1:1:1:1 |
Results:
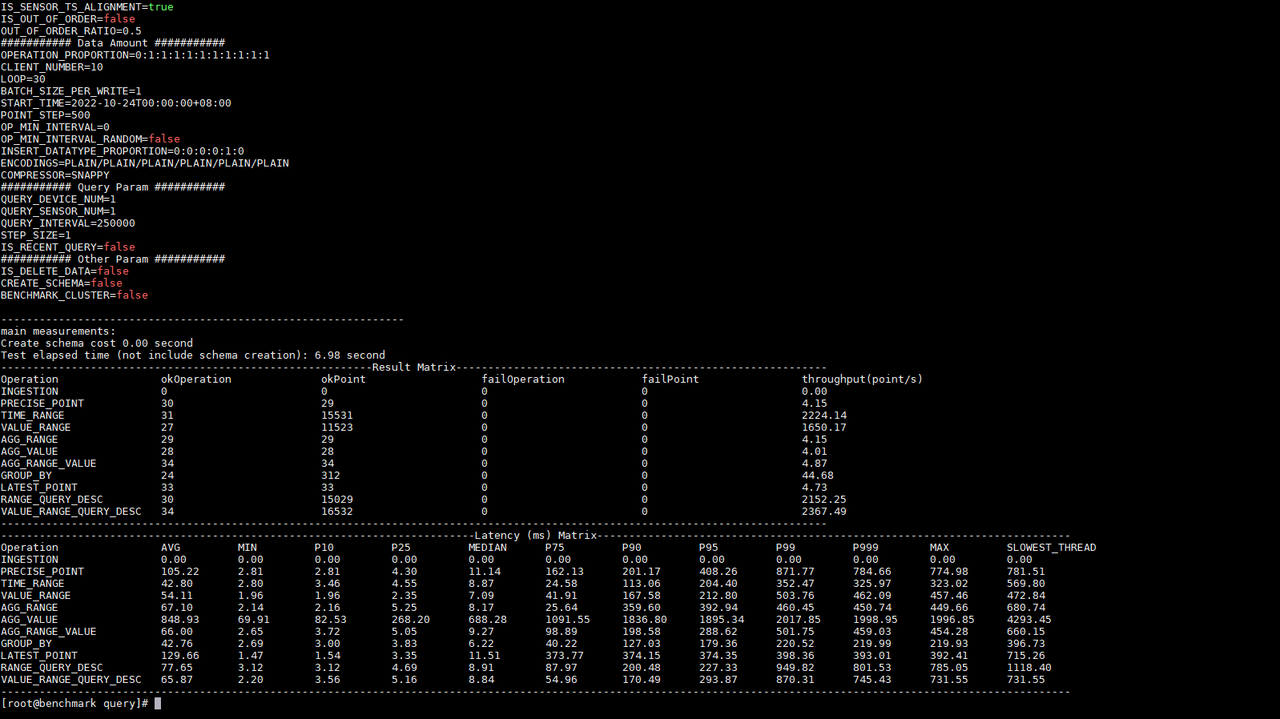
Figure 2-7 Query test results
Description of Other Parameters
In the previous chapters, the write performance comparison between Apache-IoTDB and KairosDB was performed, but if the user wants to perform a simulated real write rate test, how to configure it? How to control if the test time is too long? Are there any regularities in the generated simulated data? If the IoT-Benchmark server configuration is low, can multiple machines be used to simulate pressure output?
Table 2-5 Configuration parameter information
| Scenario | Parameter | Value | Notes |
|---|---|---|---|
| Simulate real write rate | OP_INTERVAL | -1 | You can also enter an integer to control the operation interval. |
| Specify test duration (1 hour) | TEST_MAX_TIME | 3600000 | The unit is ms; the LOOP execution time needs to be greater than this value. |
| Define the law of simulated data: support all data types, and the number is evenly classified; support five data distributions, and the number is evenly distributed; the length of the string is 10; the number of decimal places is 2. | INSERT_DATATYPE_PROPORTION | 1:1:1:1:1:1 | Data type distribution proportion |
| LINE_RATIO | 1 | linear | |
| SIN_RATIO | 1 | Fourier function | |
| SQUARE_RATIO | 1 | Square wave | |
| RANDOM_RATIO | 1 | Random number | |
| CONSTANT_RATIO | 1 | Constant | |
| STRING_LENGTH | 10 | String length | |
| DOUBLE_LENGTH | 2 | Decimal places | |
| Three machines simulate data writing of 300 devices | BENCHMARK_CLUSTER | true | Enable multi-benchmark mode |
| BENCHMARK_INDEX | 0, 1, 3 | Take the writing parameters in the previous chapter as an example: No. 0 is responsible for writing data of device numbers 0-99; No. 1 is responsible for writing data of device numbers 100-199; No. 2 is responsible for writing data of device numbers 200-299. |