WorkBench
About 2 min
WorkBench
Product Introduction
IoTDB Visualization Console is an extension component developed for industrial scenarios based on the IoTDB Enterprise Edition time series database. It integrates real-time data collection, storage, and analysis, aiming to provide users with efficient and reliable real-time data storage and query solutions. It features lightweight, high performance, and ease of use, seamlessly integrating with the Hadoop and Spark ecosystems. It is suitable for high-speed writing and complex analytical queries of massive time series data in industrial IoT applications.
Instructions for Use
| Functional Module | Functional Description |
|---|---|
| Instance Management | Support unified management of connected instances, support creation, editing, and deletion, while visualizing the relationships between multiple instances, helping customers manage multiple database instances more clearly |
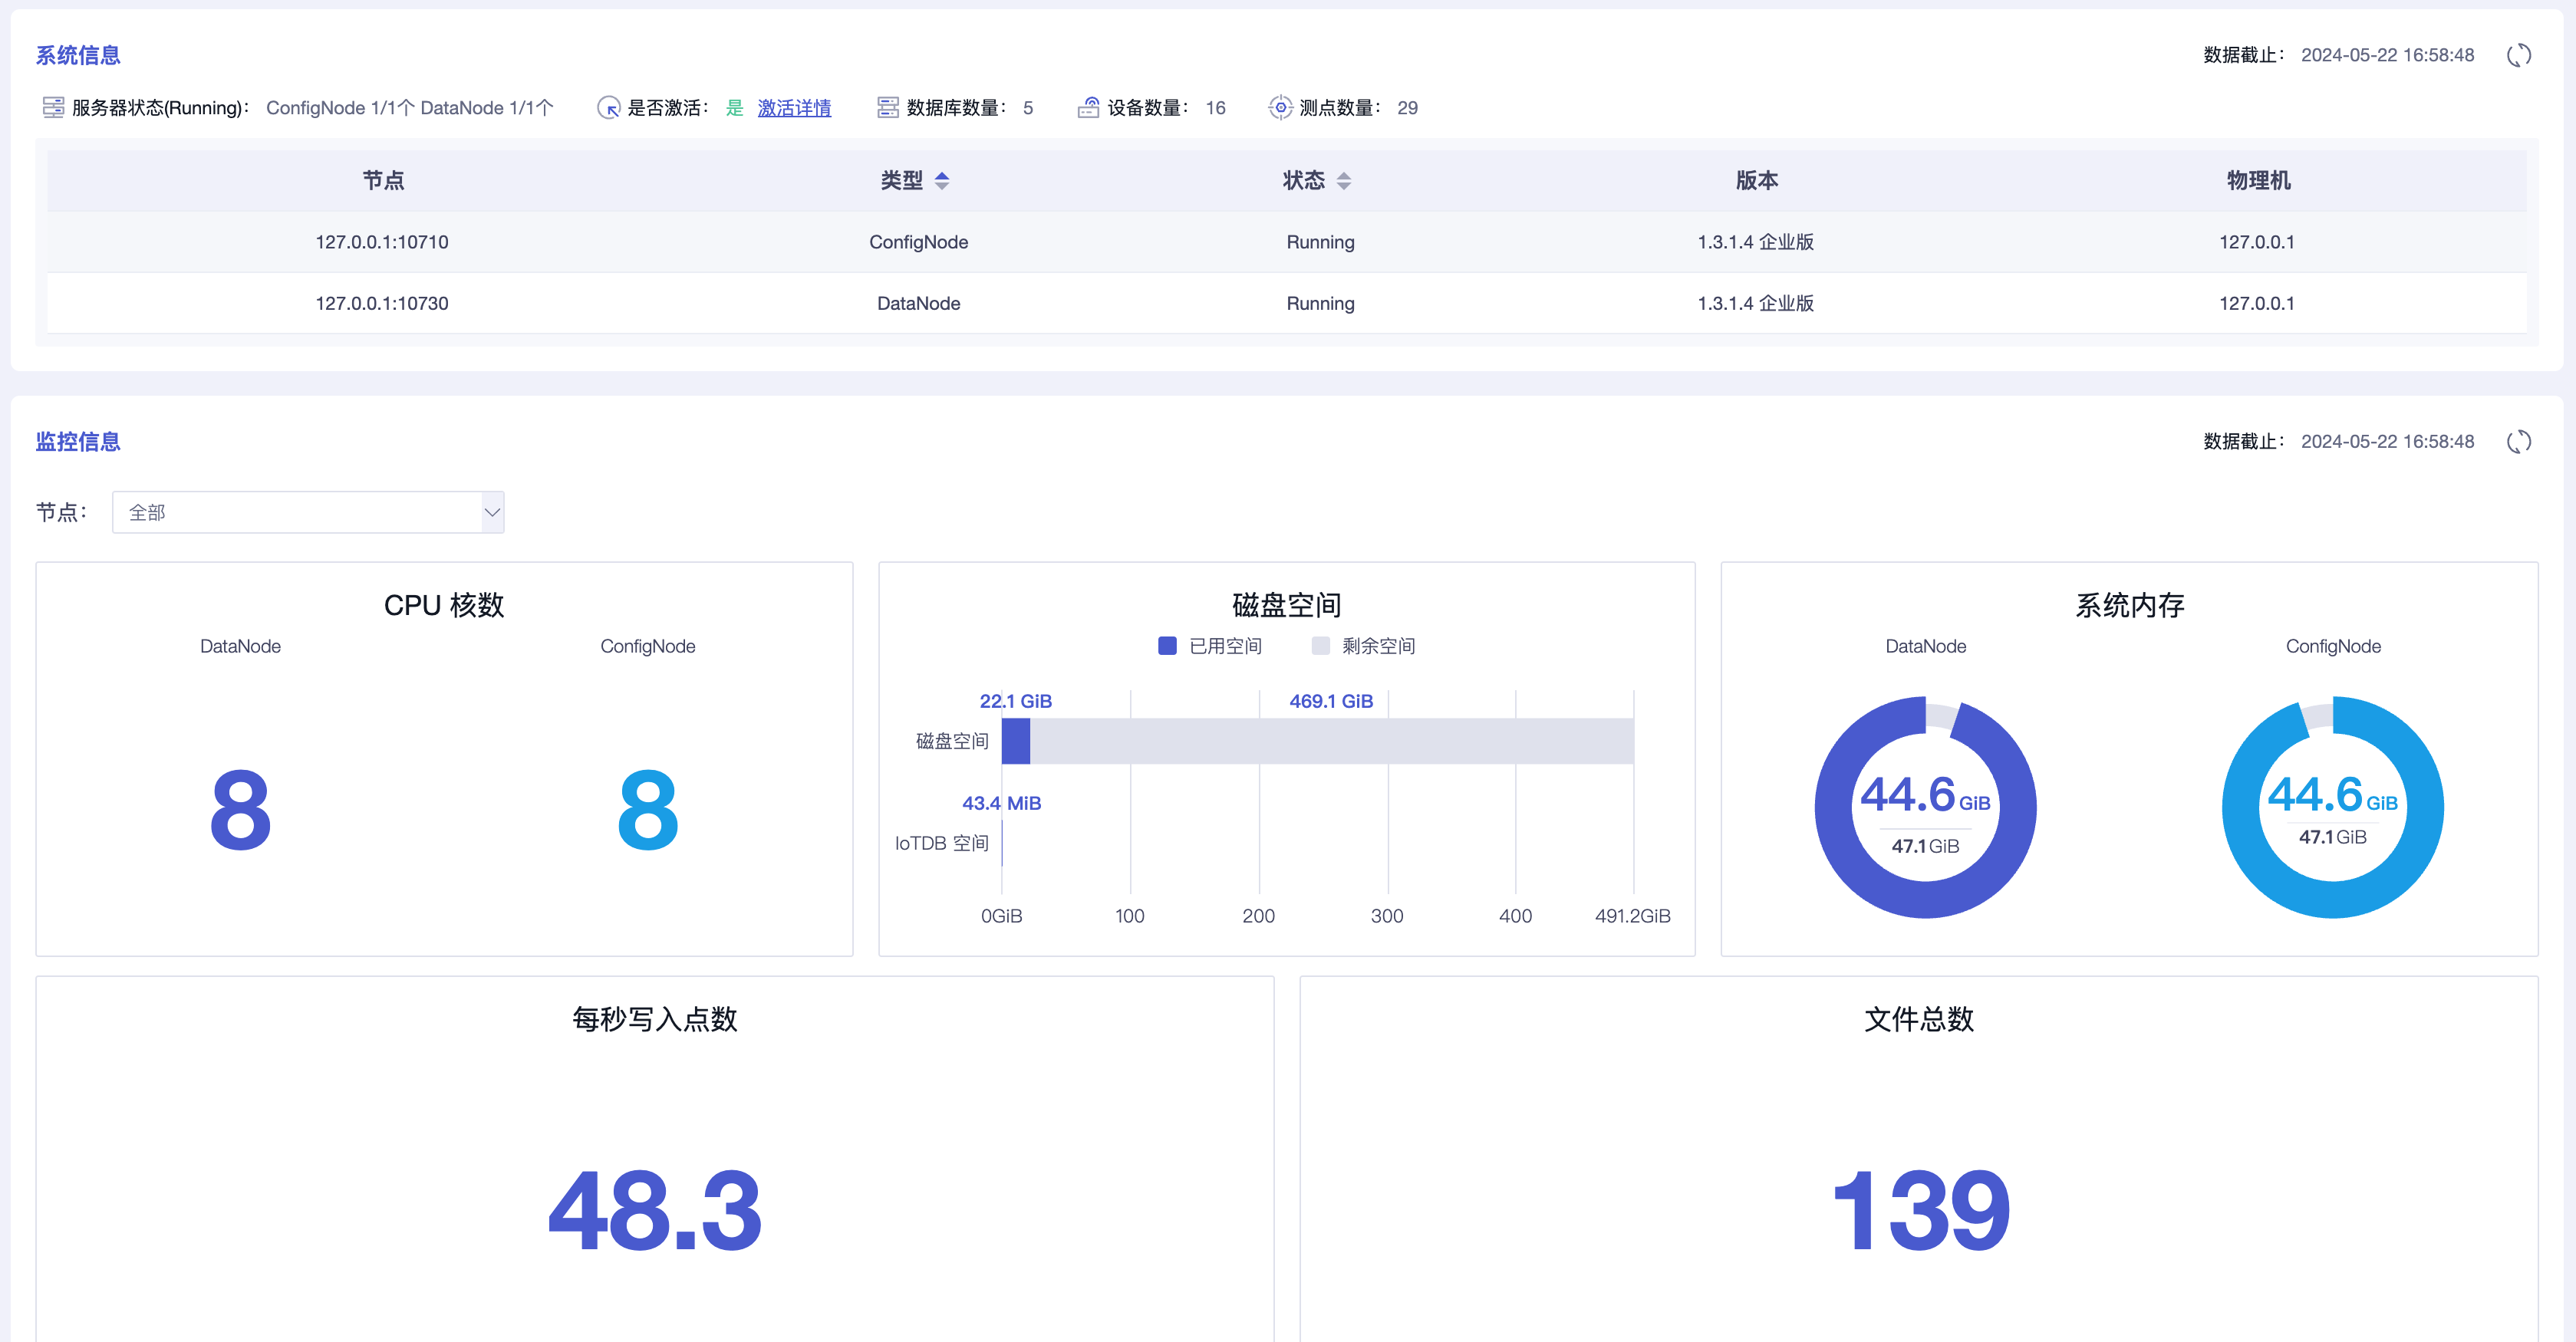
| Home | Support viewing the service running status of each node in the database instance (such as activation status, running status, IP information, etc.), support viewing the running monitoring status of clusters, ConfigNodes, and DataNodes, monitor the operational health of the database, and determine if there are any potential operational issues with the instance. |
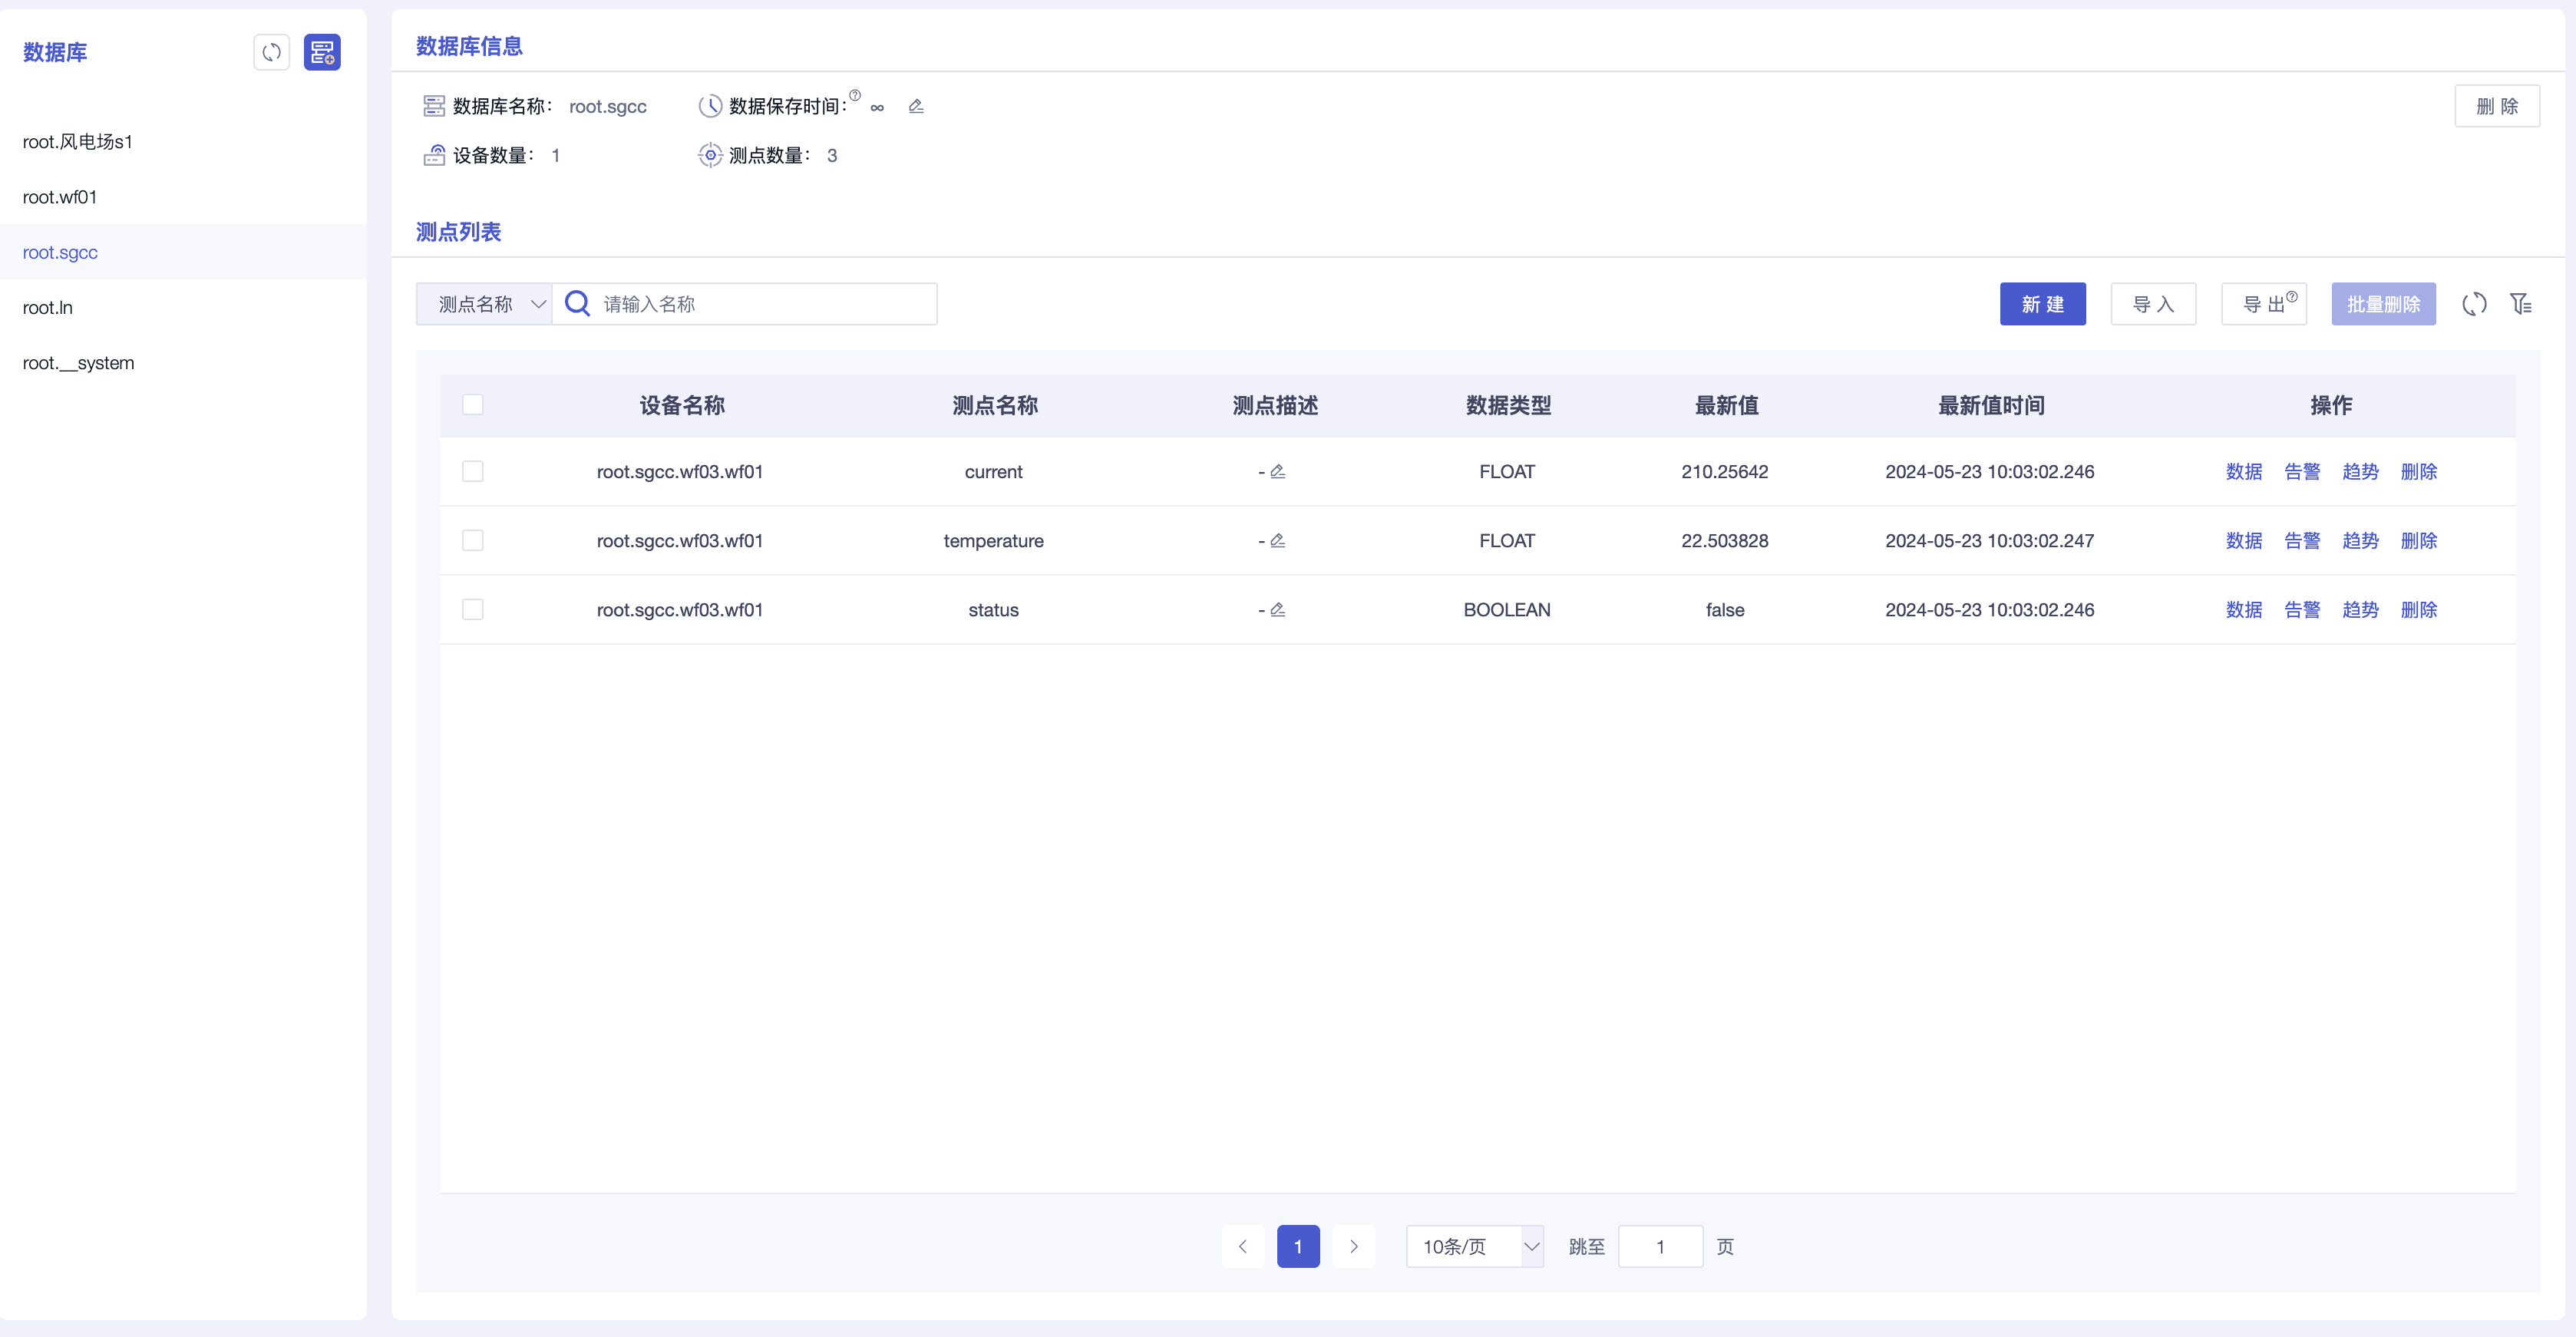
| Measurement Point List | Support directly viewing the measurement point information in the instance, including database information (such as database name, data retention time, number of devices, etc.), and measurement point information (measurement point name, data type, compression encoding, etc.), while also supporting the creation, export, and deletion of measurement points either individually or in batches. |
| Data Model | Support viewing hierarchical relationships and visually displaying the hierarchical model. |
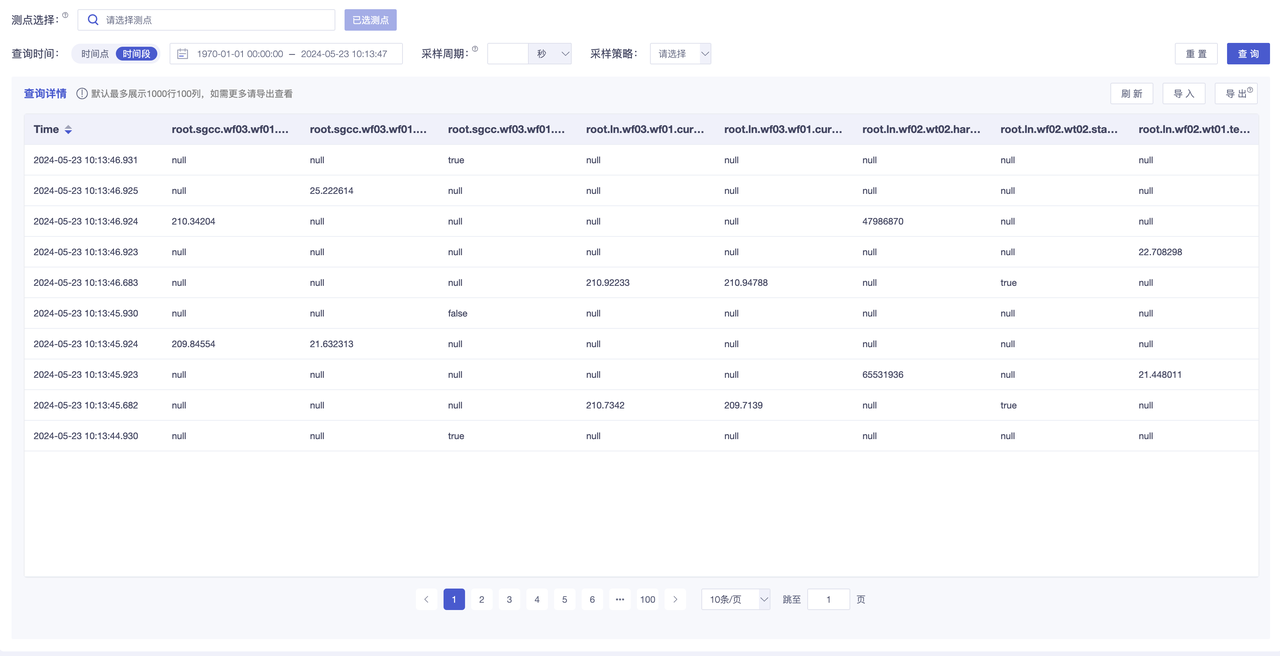
| Data Query | Support interface-based query interactions for common data query scenarios, and enable batch import and export of queried data. |
| Statistical Query | Support interface-based query interactions for common statistical data scenarios, such as outputting results for maximum, minimum, average, and sum values. |
| SQL Operations | Support interactive SQL operations on the database through a graphical user interface, allowing for the execution of single or multiple statements, and displaying and exporting the results. |
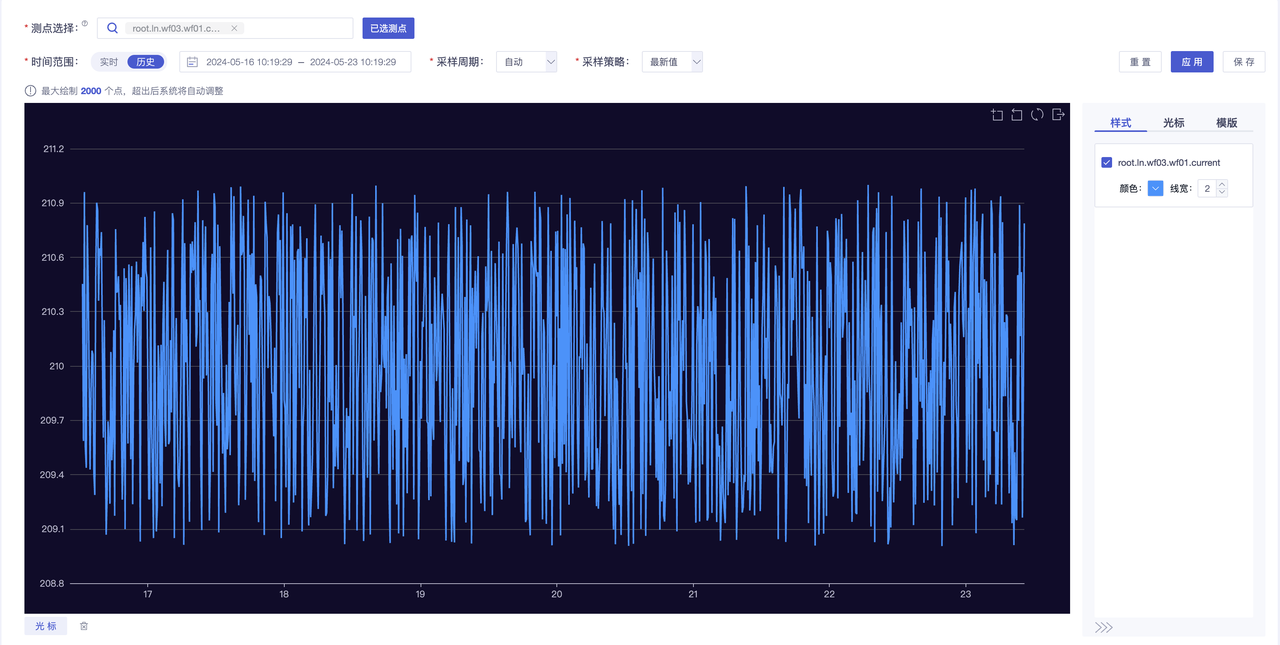
| Trend | Support one-click visualization to view the overall trend of data, draw real-time and historical data for selected measurement points, and observe the real-time and historical operational status of the measurement points. |
| Analysis | Support visualizing data through different analysis methods (such as FFT) for visualization. |
| View | Support viewing information such as view name, view description, result measuring points, and expressions through the interface. Additionally, enable users to quickly create, edit, and delete views through interactive interfaces. |
| Data synchronization | Support the intuitive creation, viewing, and management of data synchronization tasks between databases. Enable direct viewing of task running status, synchronized data, and target addresses. Users can also monitor changes in synchronization status in real-time through the interface. |
| Permission management | Support interface-based control of permissions for managing and controlling database user access and operations. |
| Audit logs | Support detailed logging of user operations on the database, including Data Definition Language (DDL), Data Manipulation Language (DML), and query operations. Assist users in tracking and identifying potential security threats, database errors, and misuse behavior. |
Main feature showcase
- Home

- Measurement Point List

- Data Query

- Trend
